Class on February 6 2018
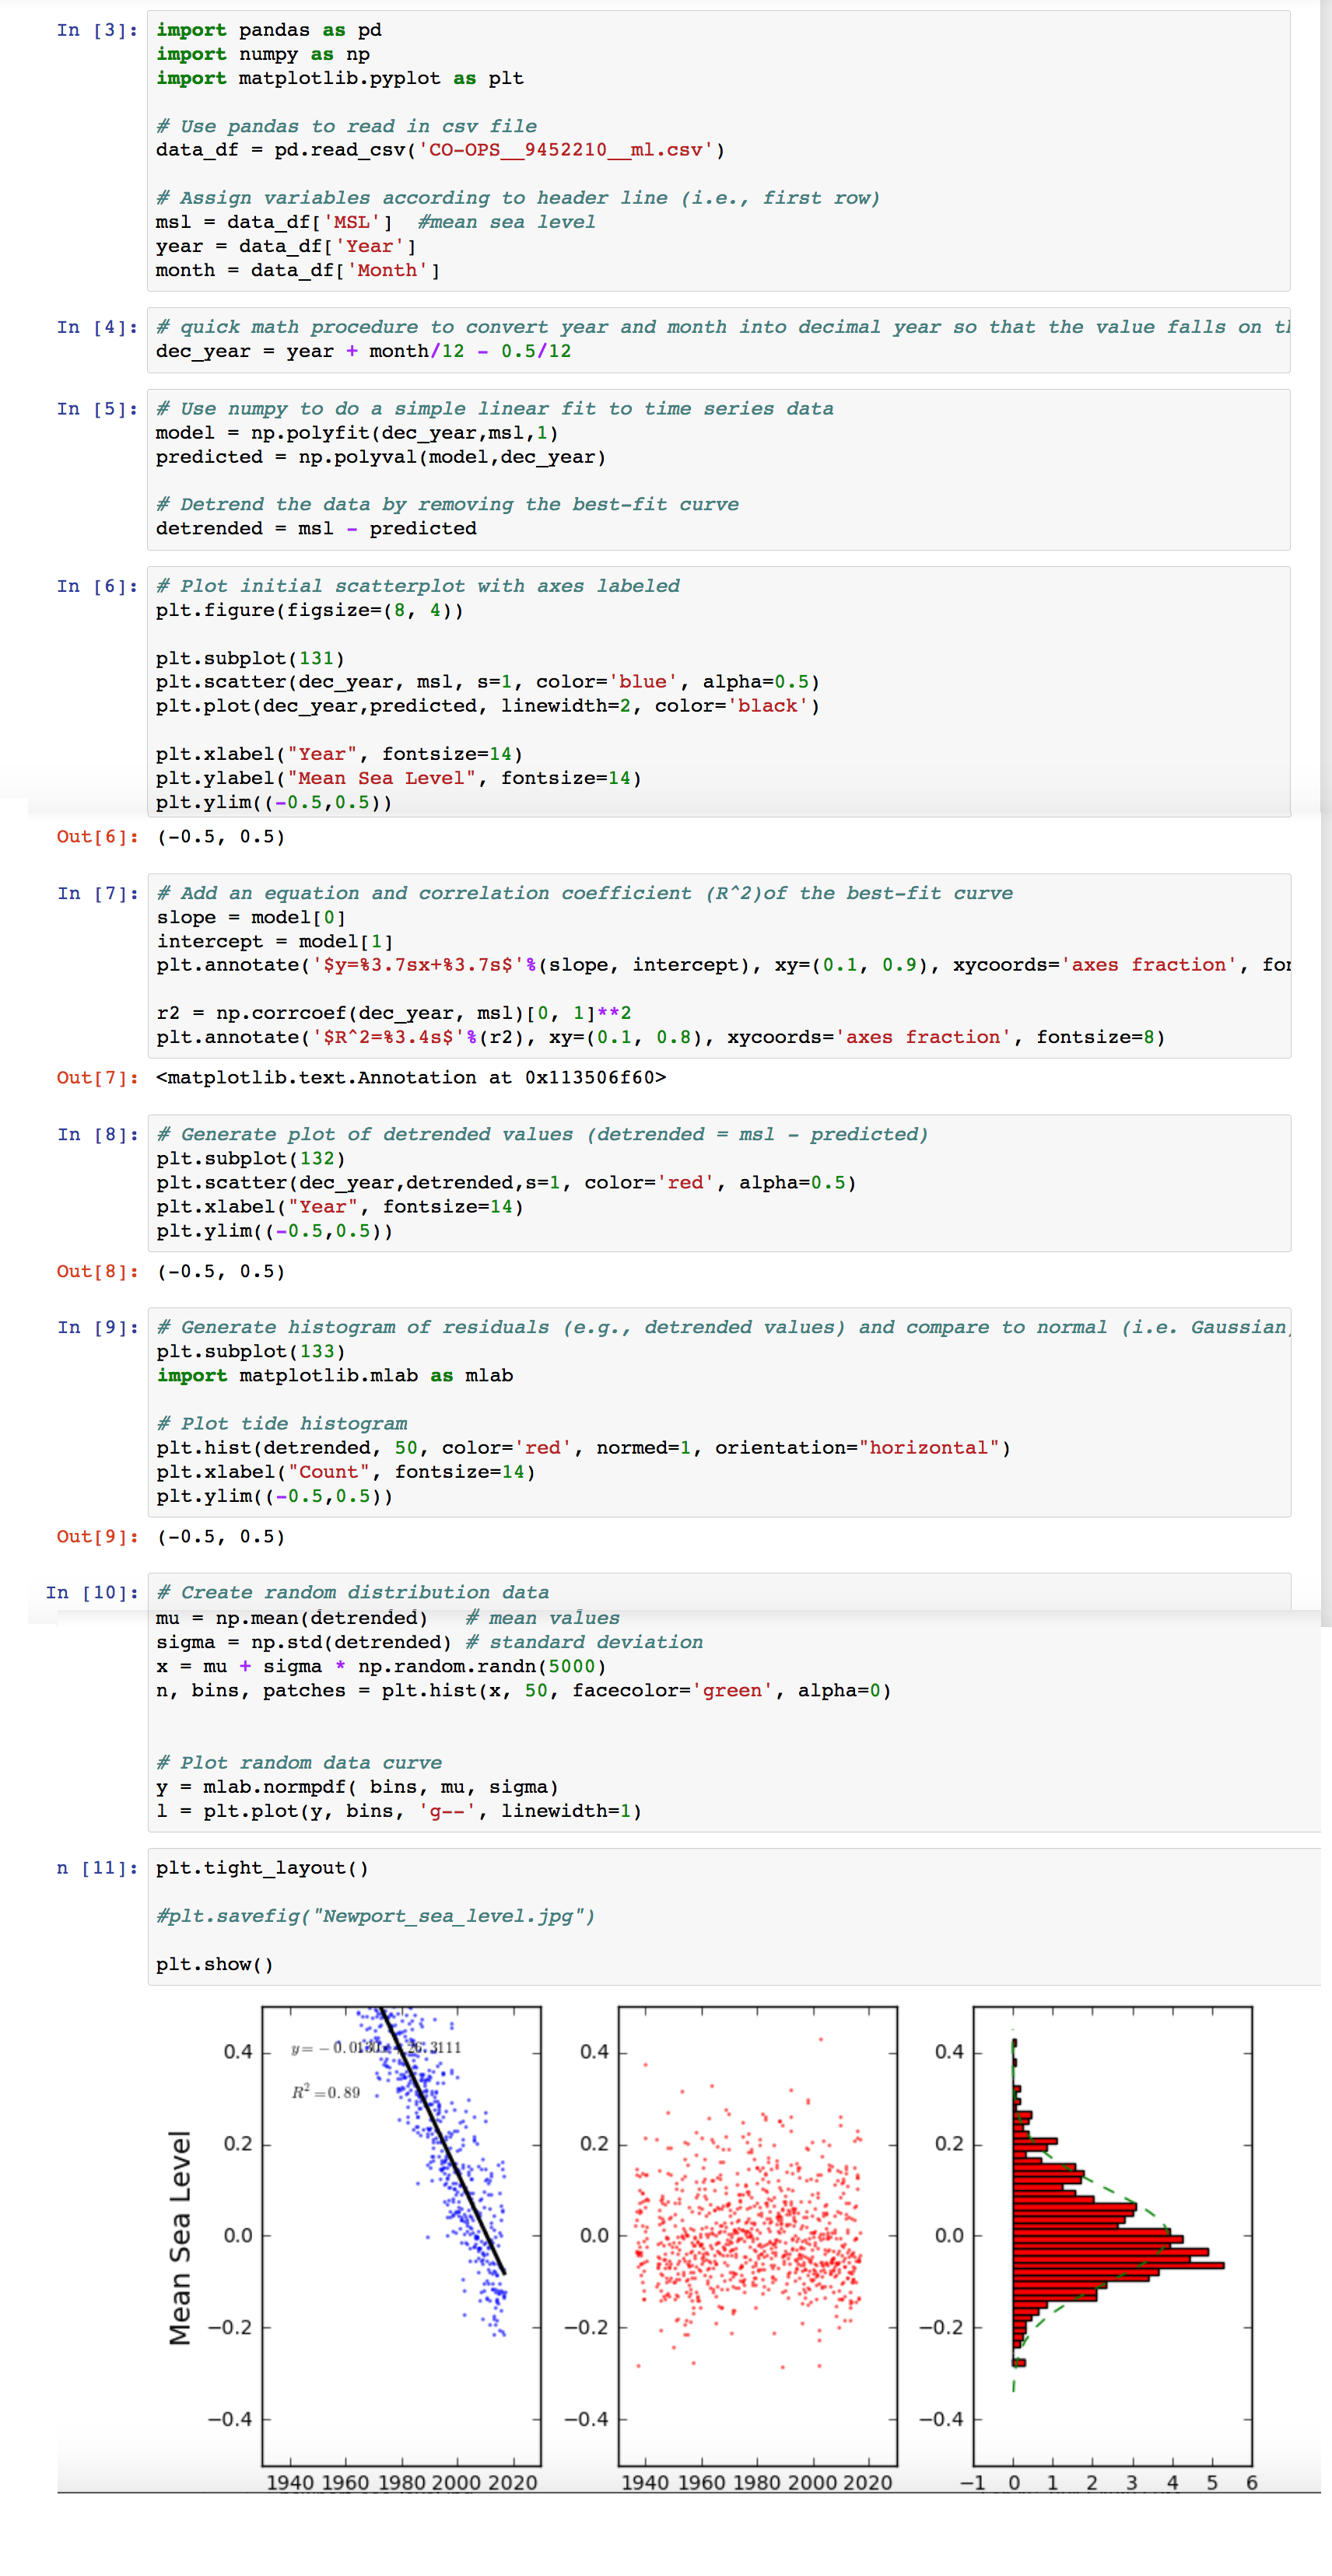
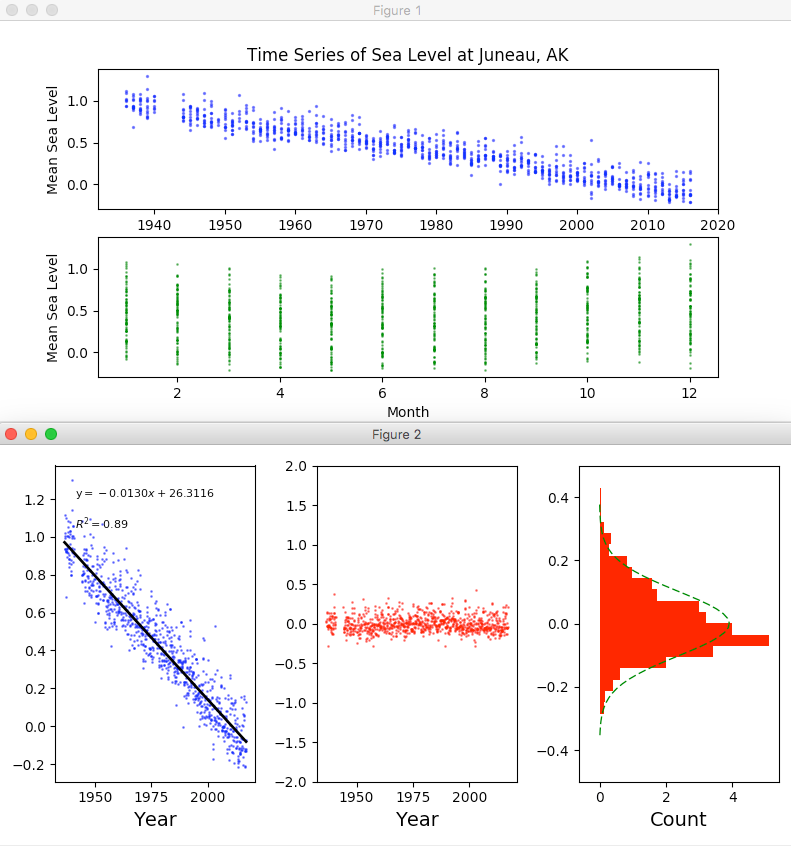
Rob asked students to show their progress in using a Python-based Jupyter Notebook to perform a sea level analysis on the Juneau, Alaska data
they had previously performed via Google Sheets. The goal was to obtain a similar output of charts and formulae: