

Class on April 19 2018
Rob introduced the Southern Alaska study site of Matt Wei's longitudinal earthquake study. Students used two of Matt's
data sets to create visualizations of both the terrain and latlon location of significant earthquake epicenters:
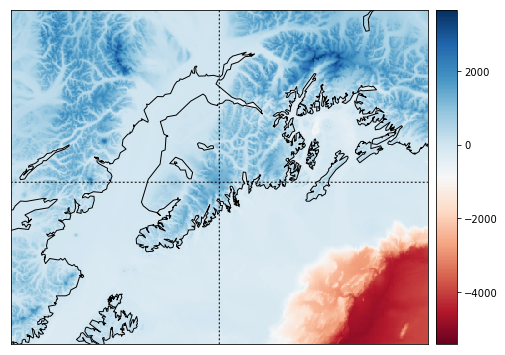
Students created visualizations of the topography/bathymetry data through use of a Jupyter Python notebook. The
terrain color map choice (see choices at
https://matplotlib.org/examples/color/colormaps_reference.html, when applied to the terrain data, looked like:
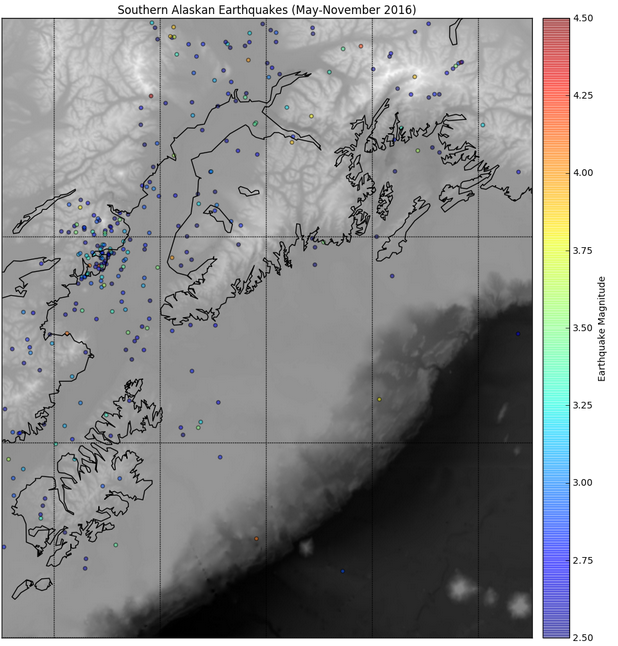
Students plotted the earthquakes, coloring dots by depth magnitude, with Python as well. The earthquakes were located as seen here:
Rob also provided a Jupyter Python notebook to create CSV files by writing out data from other data formats. Students were asked to continue to work with their Alaska notebooks to play with the data sets they downloaded.