

Class on April 12 2018
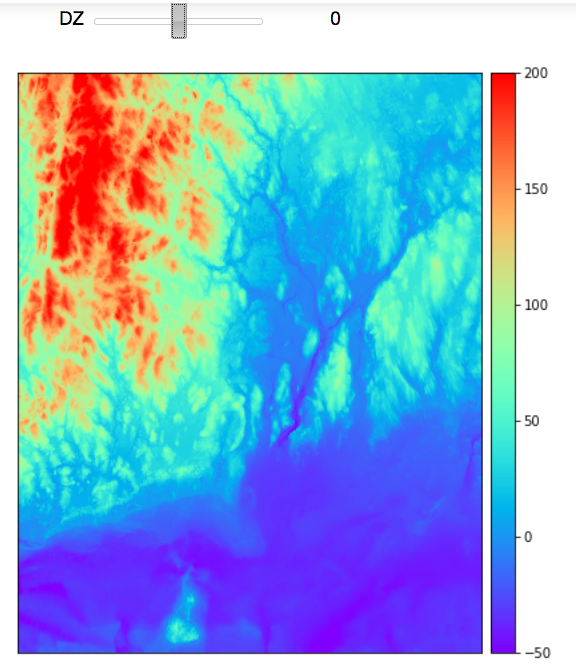
Rob reviewed the Jupyter notebook Python code that created the interactive sealevel visualization tool seen below (using the
ri.grd grid file available):
Rob then discussed the student analyses that were created similar to the examples from last (Tuesday's) class. He used them as a launching point for a discussion of the final class projects.
The emphasis on the project would be two-fold: demonstrating competence at creating Python code for an earth science dataset evaluation, and creating a companion report to present and discuss the analysis process, results, and significance.
Suggested steps include:
- Generate Python code to illustrate a temporal-spatial phenomenon in map & graphical form.
- Find and read a geo-referenced database with a time component.
- Plot geo-referenced data on a basemap derived from NetCDF or ASCII table.
- Represent magnitude of the geo-referenced data with color or shape or both.
- Plot the database in graphical form as well.
- Animate the representation.
- Perform some sort of statistical analysis on the data... preferably meaningful.
- Annotate code and provide references to data.
- Write companion report with requisite components:
- motivation
- code description (major steps)
- interpretation of results