

Class on March 29 2018
Rob introduced the class to more sources of good environmental data related to the oceans online. Those resources are listed as part of the class Content Management System
within the Reference section. Students were asked to choose one or more data sets of interest
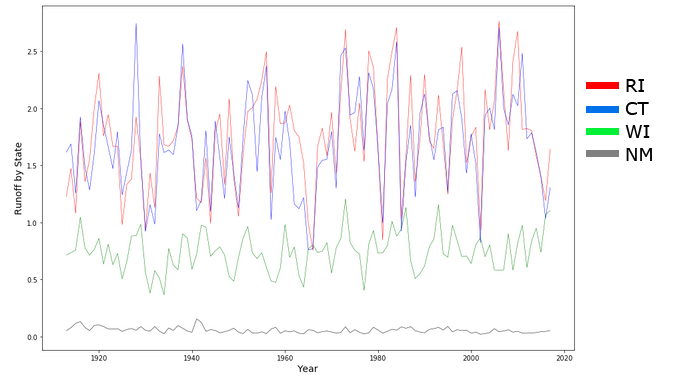
in order to perform their own time series analysis on the data. As an example below, four states were selected (RI, CT, WI, and NM) for a yearly run-off analysis (water
that runs off the terrain and into streams, lakes, and estuaries — mainly from precipitation events). The data is available within the
USGS Water Watch website. Each of the four states has a historical data page and the four states had data from
1913 to 2017 (available here as a CSV file).
Plotting the four states suggests Connecticut and Rhode Island have similar precipitation and run-off experiences while Wisconsin (a state with significantly less impervious surface) has slightly less runoff and New Mexico (a dry state with much desert) has very little run off due to low preciptation:
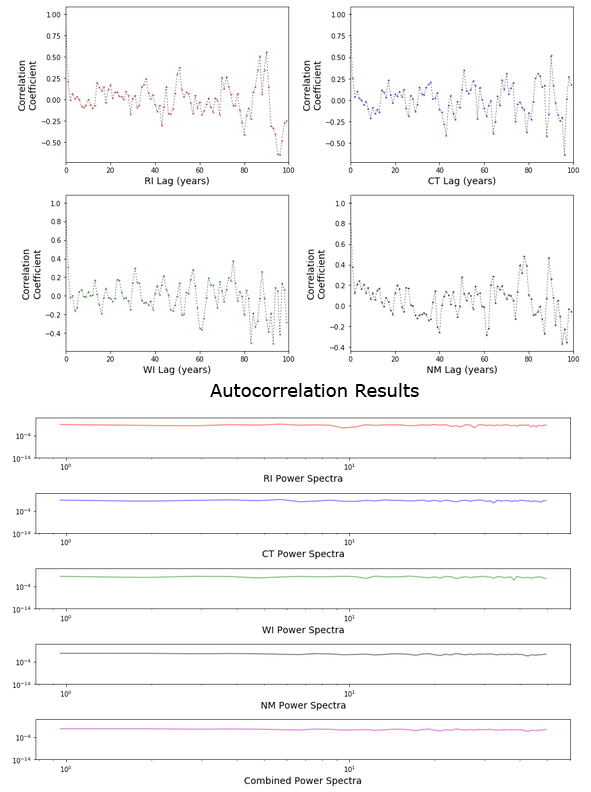
Performing both autocorrelation and power spectra analyses showed very little predictability in the data over time. The data is not detrended as no significant trend was found in all four states (and yet, both RI and CT have become concerned with the effects of groundwater run-off in recent years):
Students were asked to find interesting data they would be interested in performing analyses upon using the tools studied up to this point in class. Class time would be used next week to help student work progress, but students were encouraged to do as much analysis on their own until then.
Plotting the four states suggests Connecticut and Rhode Island have similar precipitation and run-off experiences while Wisconsin (a state with significantly less impervious surface) has slightly less runoff and New Mexico (a dry state with much desert) has very little run off due to low preciptation:
Performing both autocorrelation and power spectra analyses showed very little predictability in the data over time. The data is not detrended as no significant trend was found in all four states (and yet, both RI and CT have become concerned with the effects of groundwater run-off in recent years):
Students were asked to find interesting data they would be interested in performing analyses upon using the tools studied up to this point in class. Class time would be used next week to help student work progress, but students were encouraged to do as much analysis on their own until then.