

Class on March 27 2018
Rob introduced the data analysis skill involved with using power spectra techniques. Power spectra techniques can identify and then separate
components of a time series. In the case of mean water level analysis, the class studied tidal effects and seasonal effects of sea level. Those
effects were anticipated and therefore ready to analyze independently. But what if a signal presents data in a realm where the component
effects (drivers) were unknown?
Rob demonstrated bi-directional use of power spectra techniques. He demonstrated a forward approach of creating sine waves with different frequencies and combining them to see the resultant combined wave:
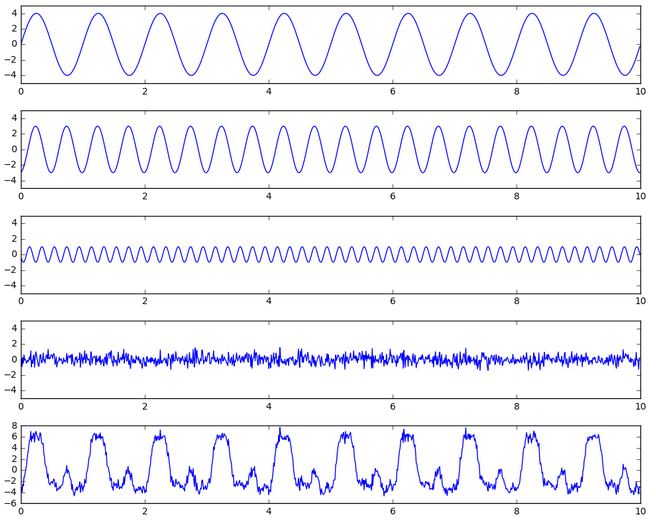
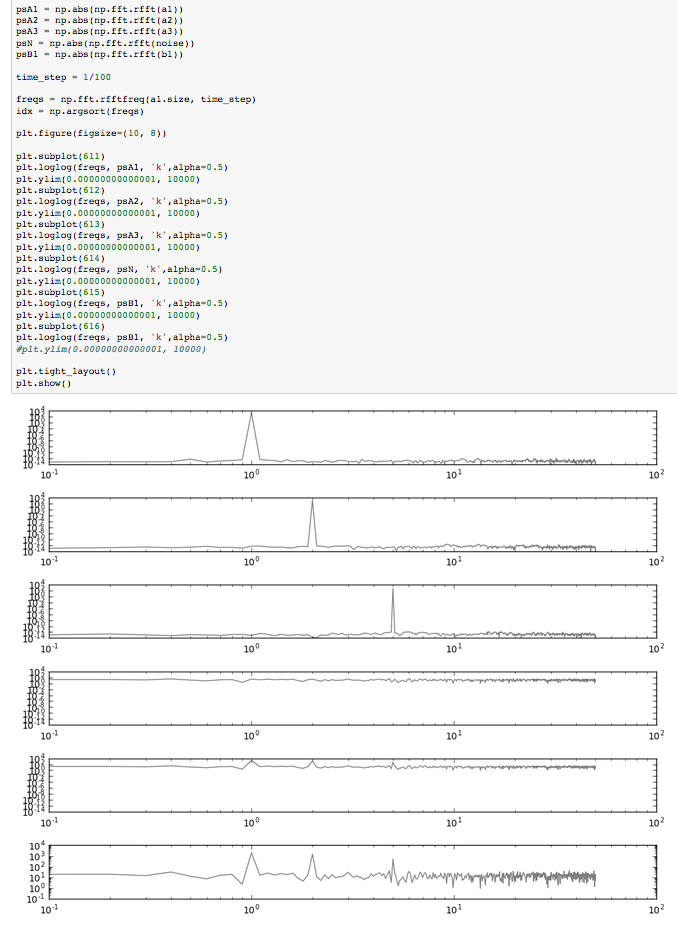
We then used a Python-based Jupyter notebook to perform an inverse analysis along the lines of a Fourier analysis of a signal. The goal was to identify the different sine waves in the signal. The python numpy package provides an fft collection of services including the rfft method that can identify the regularity of a sine wave pattern in a signal. The five signals above (a1, a2, a3, noise, and b1) resulted in the following notebook outputs:
Students were encouraged to add power spectra analysis tools to their bag of tricks for upcoming projects that were being started for homework and discussed in the next class.
Rob demonstrated bi-directional use of power spectra techniques. He demonstrated a forward approach of creating sine waves with different frequencies and combining them to see the resultant combined wave:
We then used a Python-based Jupyter notebook to perform an inverse analysis along the lines of a Fourier analysis of a signal. The goal was to identify the different sine waves in the signal. The python numpy package provides an fft collection of services including the rfft method that can identify the regularity of a sine wave pattern in a signal. The five signals above (a1, a2, a3, noise, and b1) resulted in the following notebook outputs:
Students were encouraged to add power spectra analysis tools to their bag of tricks for upcoming projects that were being started for homework and discussed in the next class.