Class on March 22 2018
Students continued working on their filtering techniques through use of a Jupyter Python notebook. Rob asked them to create filter to isolate
the tidal signal (3 to 33 hours) and show it beside another noise filter that had been applied to detrended data. He asked students to do it
for temperature at both surface and depth locations, as well as for the water level captured by the surface sensor. The results would look something
like:

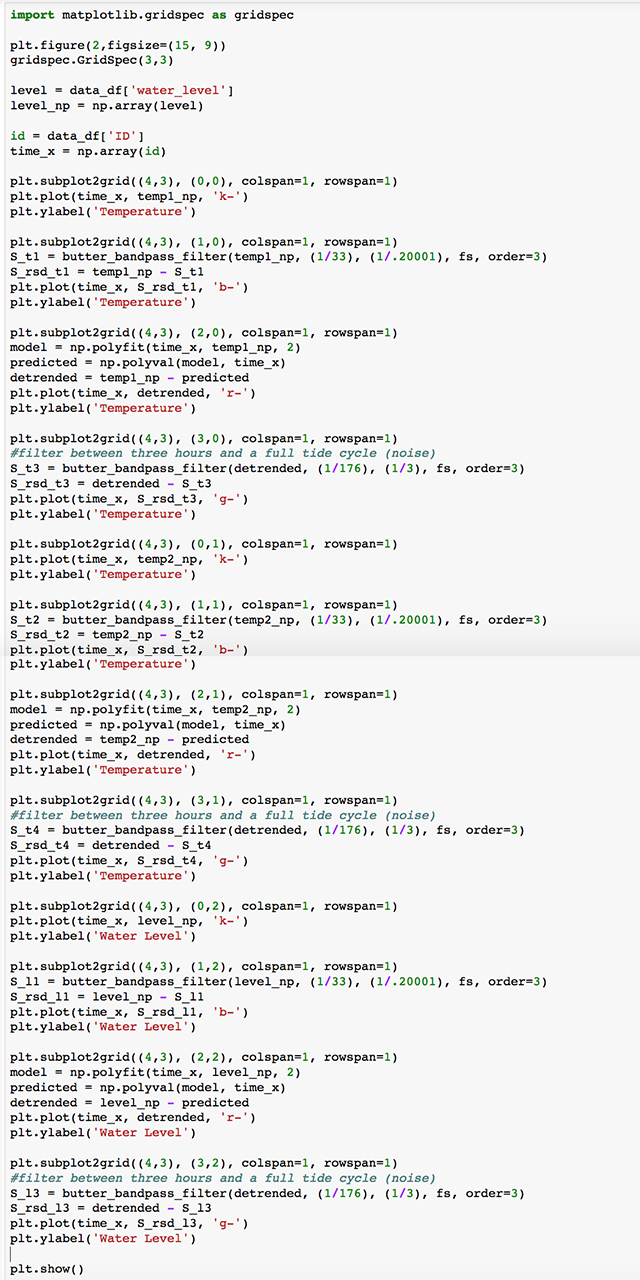
Python code to generate the above image is captured in a screenshot of a Jupyter notebook here:

Students were asked to create a formal analysis of all the filtering results as a homework assignment.

Python code to generate the above image is captured in a screenshot of a Jupyter notebook here:

Students were asked to create a formal analysis of all the filtering results as a homework assignment.

