

Class on March 8 2018
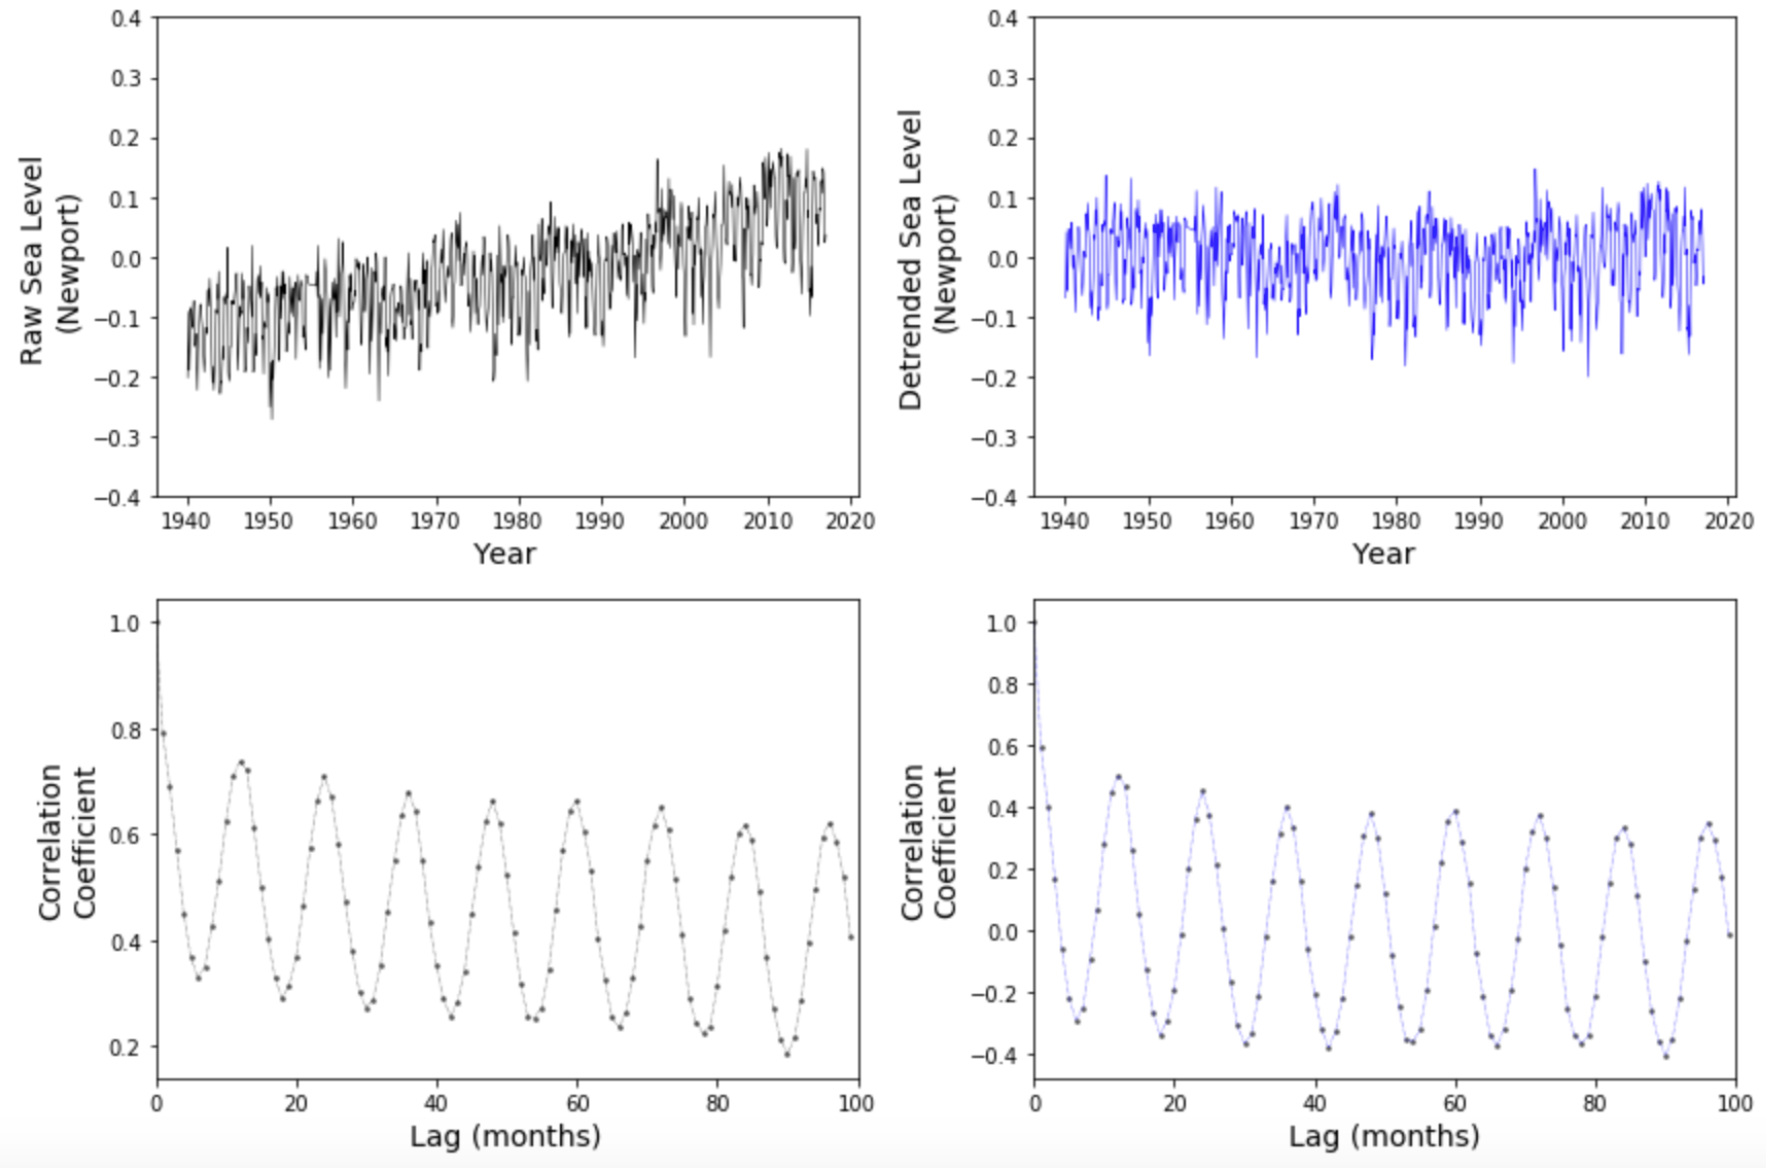
Students created an autocorrelation notebook for use with the Narragansett Bay mean sea level data. Autocorrelation can be performed on an array
of data through the autocorr(n) method, whereby n is the distance to offset values for comparison. By running the method within a
loop that increases the offset by one each time, an evaluation can be made as to what offset distance tends to repeats a pattern over time.
Students compared offsets from 1 to 99 (an offset of 0 always correlates to 1.0, full correlation) and plotted the outputs for both
the raw mean surface level and detrended surface level.
The results suggested a seasonal pattern of water level cycles with a twelve-month offset peak in correlation value. The detrended analysis provided a more realistic result as the six-month correlations appear negatively correlated and the correlation values range from -.4 to .4. Since the pattern repeats so similarly over the 99-month analysis, the twelve month cycle appears to be dominant, dwarfing other possible cycles. The data temporal resolution is coarse with means provided once a month. Different patterns would be visible with a much higher temporal resolution.
For homework, students were asked to refine their code to include features from previous classes and to post their final results in the content management system