

Class on March 6 2018
Rob provided a lecture on two-parameter correlation, autocorrelation, and cross-correlation which are techniques of analysis to look for trends
in data. The least squares approach used in class often help determine general trends over time without emphasis on cyclical components. Many
phenomena in nature have a cyclical component (day-night, seasonal, tidal, etc.) and the techniques covered in class help identify those for
consideration.
Rob suggested we perform a cyclical analysis of the Narragansett Bay mean sea level data we obtained the first week of class. Autocorrelation requires that we detrend the data to a mean of zero before looking for cycles. Cross-correlation requires that we detrend the data to a mean of zero and normalize the data before looking for cycles.
Students were asked that they spend the rest of the week trying to do a Python Jupyter notebook analysis of the tide data to obtain results that look like this image here:
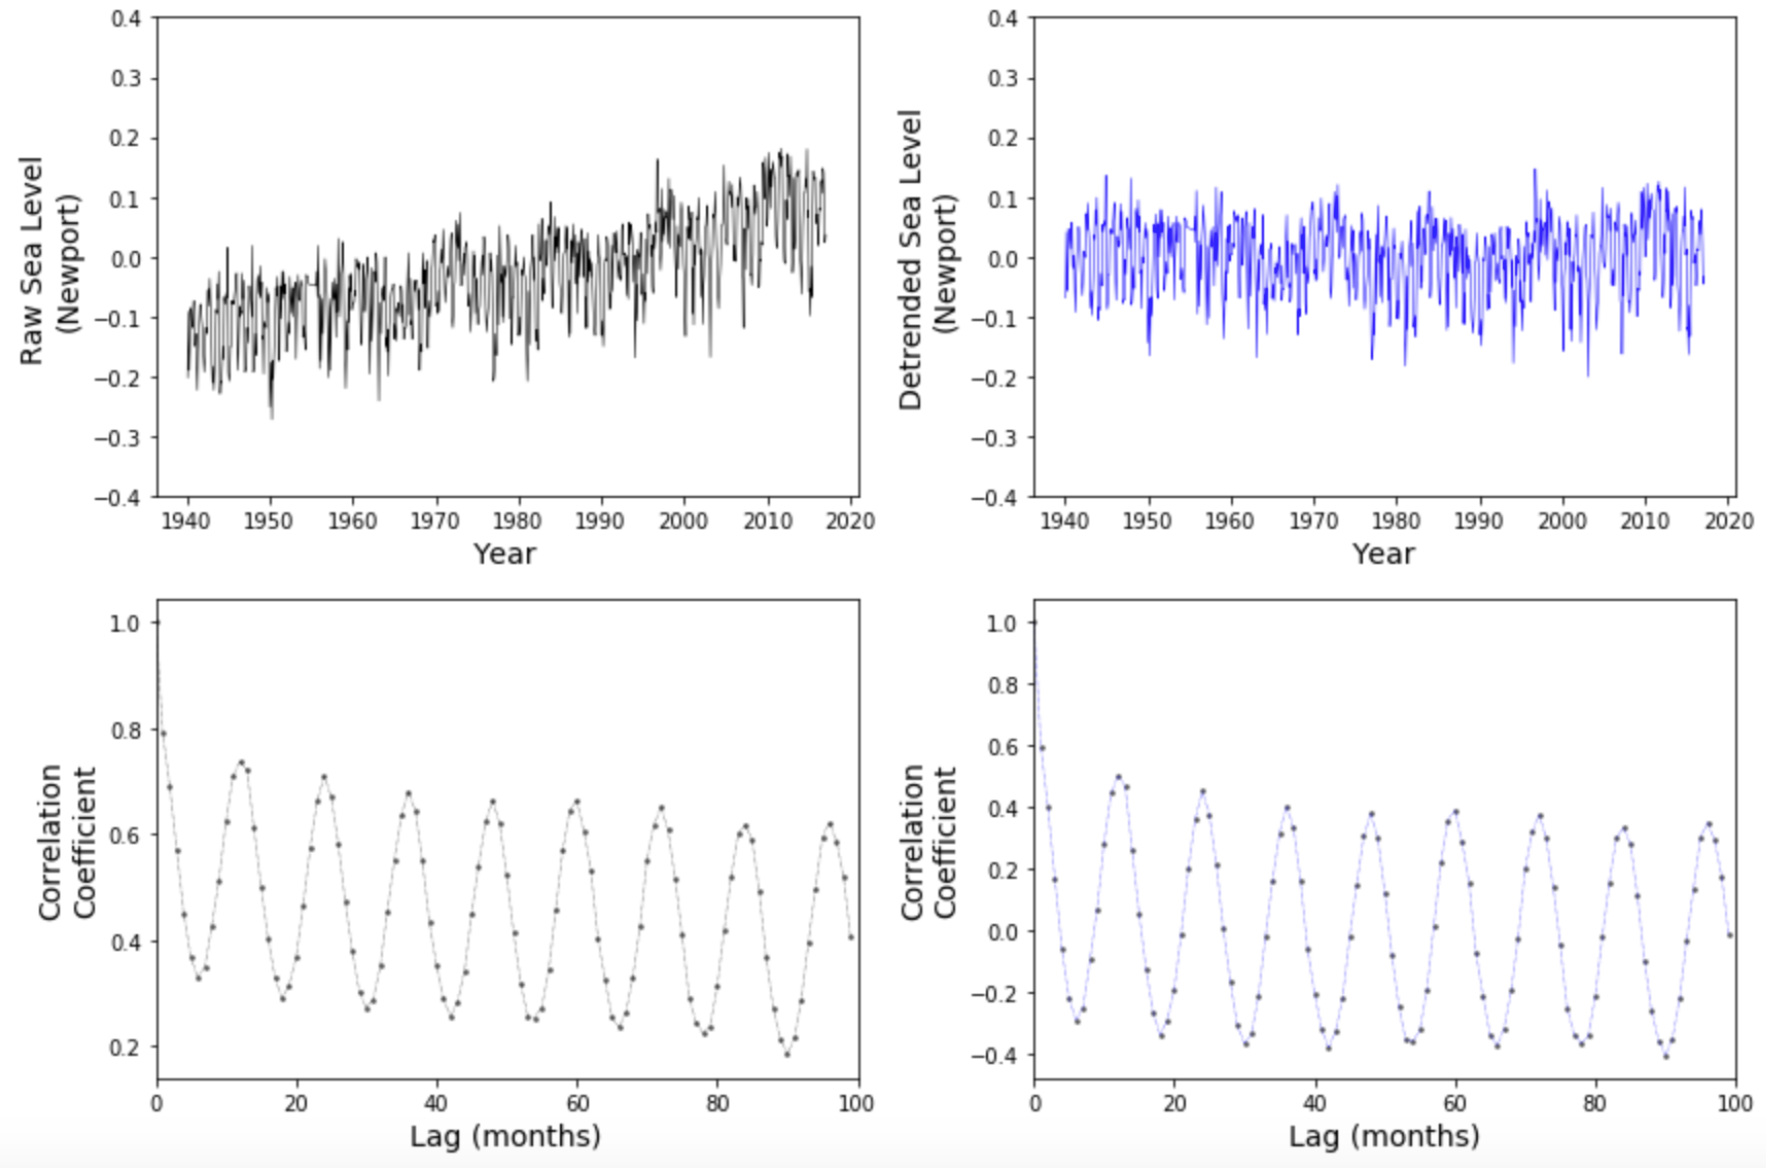
Rob promised to help with the code during the next class.
Rob suggested we perform a cyclical analysis of the Narragansett Bay mean sea level data we obtained the first week of class. Autocorrelation requires that we detrend the data to a mean of zero before looking for cycles. Cross-correlation requires that we detrend the data to a mean of zero and normalize the data before looking for cycles.
Students were asked that they spend the rest of the week trying to do a Python Jupyter notebook analysis of the tide data to obtain results that look like this image here:
Rob promised to help with the code during the next class.