

Class on February 22 2018
Rob started with a description of hydrographic science as the study of water column properties (as seen in the previous lecture, his
interests extend into the seafloor). He shared a hydrographic data website recommendation
and everyone in class chose a region of the ocean from which to download representative data.
Some of the downloadable websites included multiple vertical casts within the same data set. For example, this Atlantis cruise hydrologic data set included casts for a very long cruise from northern atlantic ocean to southern atlantic ocean.
Other downloadable data sets provided only one cast per file such as this Drake Passage cruise hydrolic data set that was one of thirty such files available for download in a single .zip archive.
Rob asked students to create Jupyter notebooks from scratch for visualizing scatterplots of three variables (temperature, salinity, and oxygen) in a download of their choice. Resulting Altlantis cruise scatter plots look like:
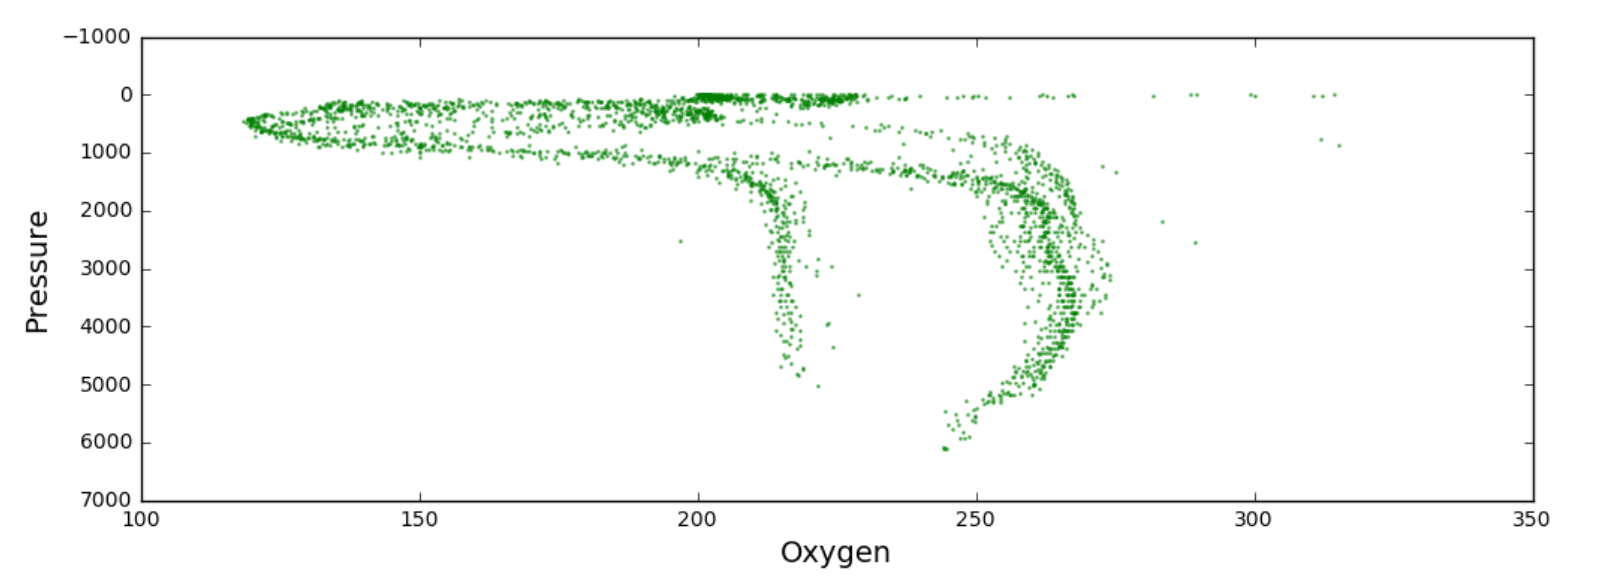
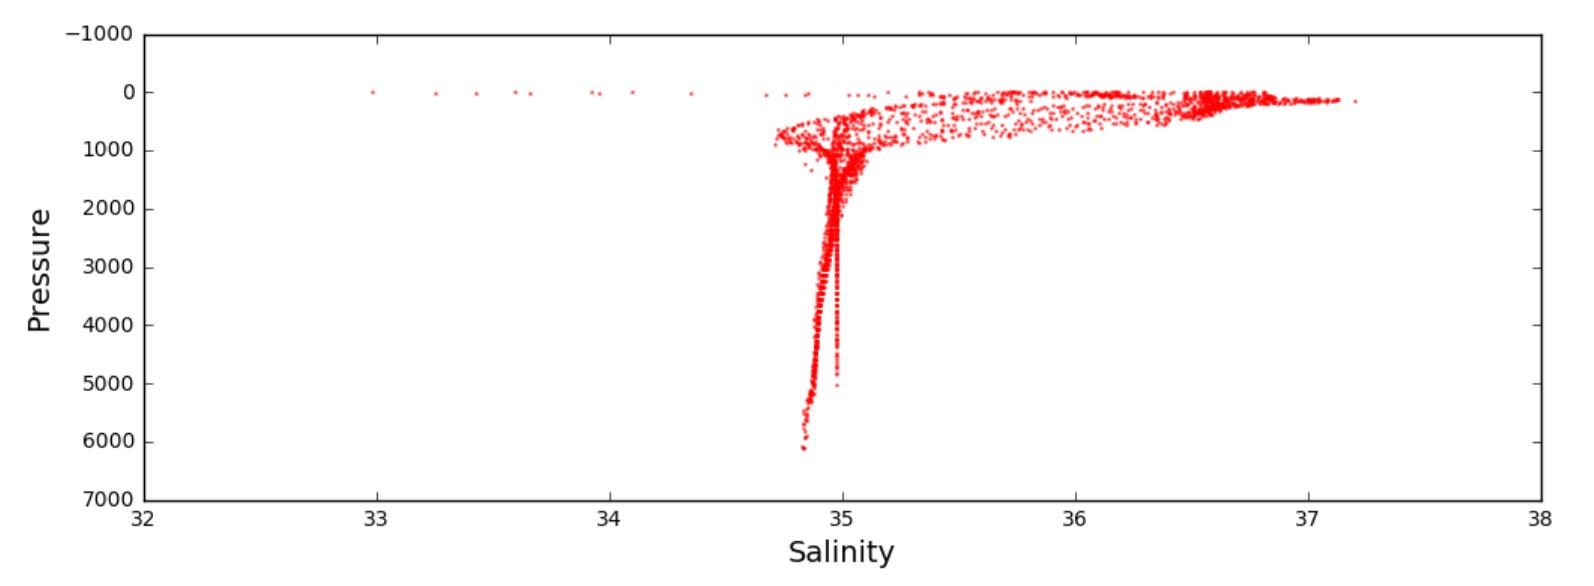
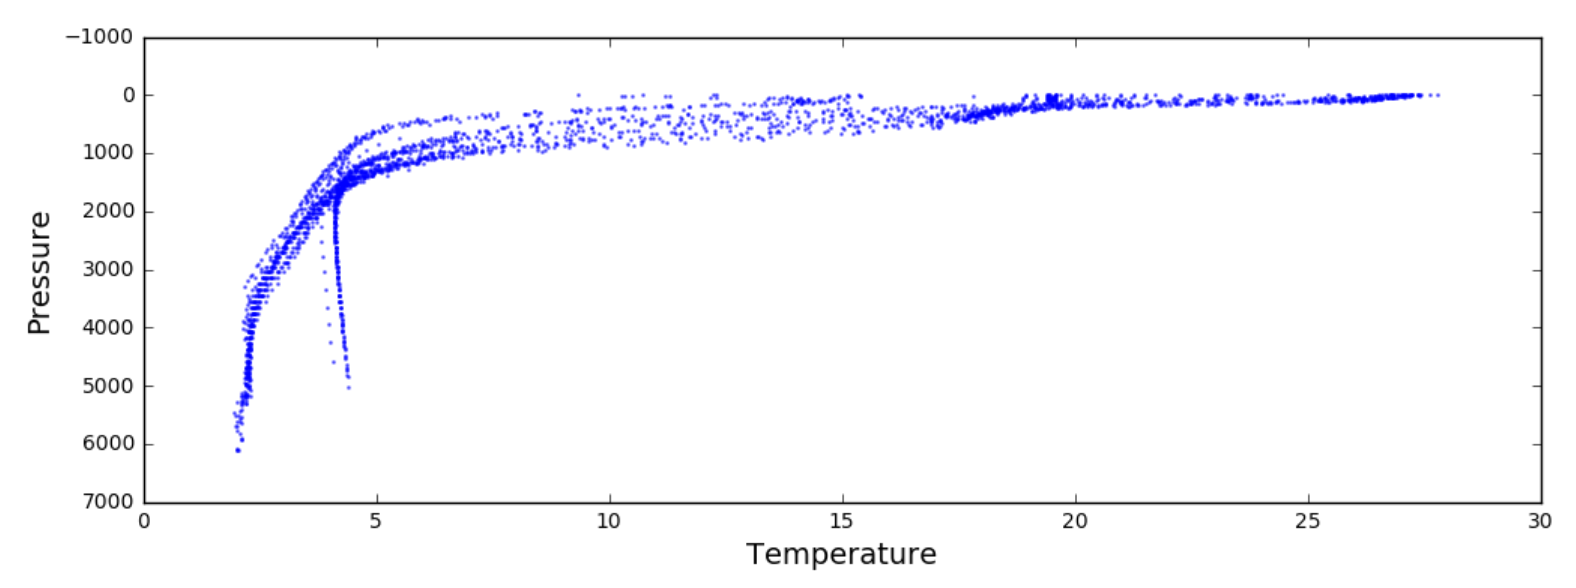
whereas the Drake Passage cruise scatter plots could be packaged into a movie by looping through each separate cast data set file provided:
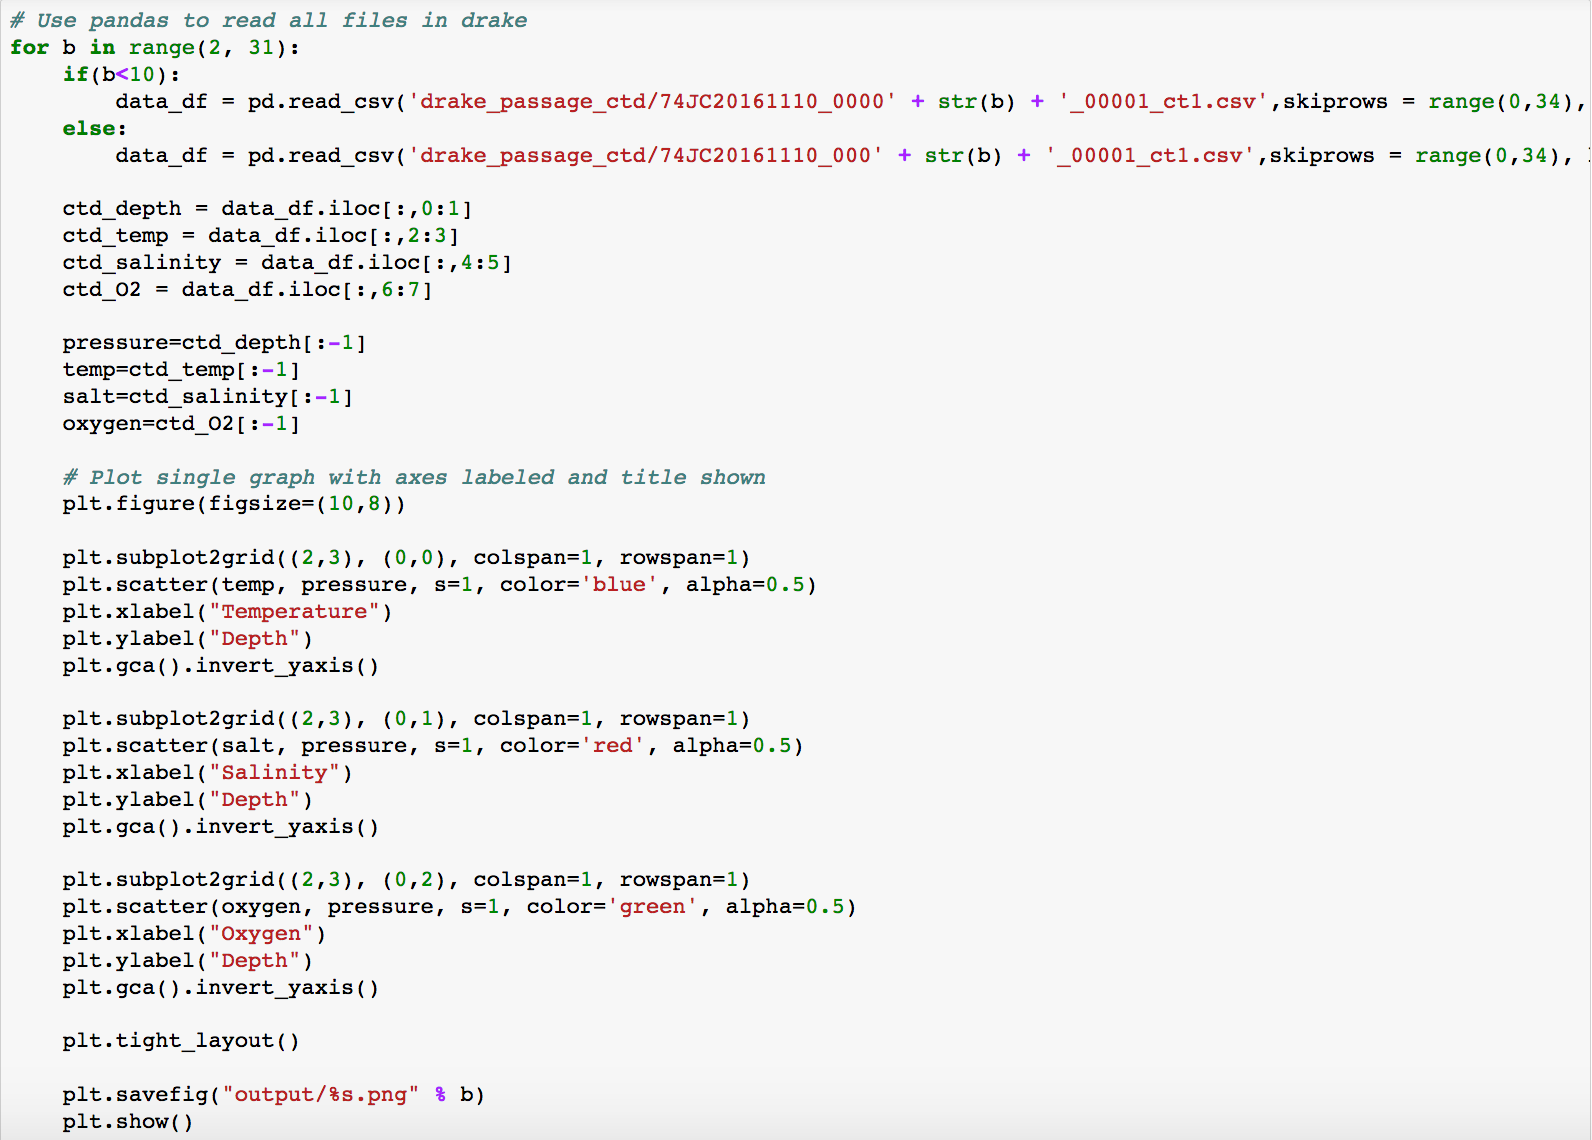
The video was put together from the outputs generated by the following Python script:
For homework, students were then asked to refine their code to include features from previous classes or new features from online research.
Some of the downloadable websites included multiple vertical casts within the same data set. For example, this Atlantis cruise hydrologic data set included casts for a very long cruise from northern atlantic ocean to southern atlantic ocean.
Other downloadable data sets provided only one cast per file such as this Drake Passage cruise hydrolic data set that was one of thirty such files available for download in a single .zip archive.
Rob asked students to create Jupyter notebooks from scratch for visualizing scatterplots of three variables (temperature, salinity, and oxygen) in a download of their choice. Resulting Altlantis cruise scatter plots look like:
whereas the Drake Passage cruise scatter plots could be packaged into a movie by looping through each separate cast data set file provided:
The video was put together from the outputs generated by the following Python script:
For homework, students were then asked to refine their code to include features from previous classes or new features from online research.