September 19 2017 Class Notes
Rob provided a Powerpoint presentation to foster a discussion reviewing the kayaking data collection field trip on September 14, 2017 as well as present an analysis of the HOBO and GPS data he collected as a participant.
Bruce followed the steps below to create a similar analysis with his and Kathy's kayak's data for GPS and HOBO temperature (but with the times he noticed on his cell phone - 3:16pm getting in the water and 5:46pm getting out:
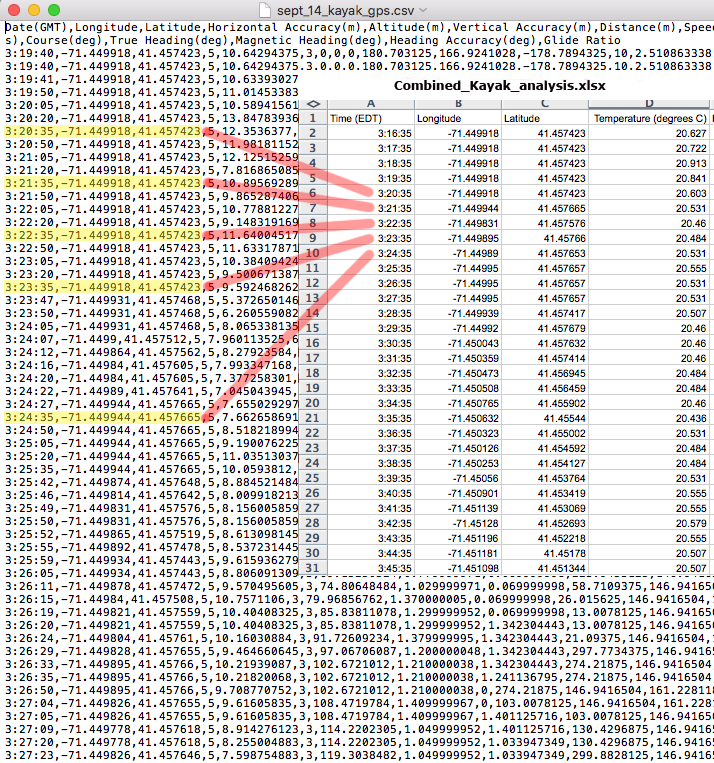
1. We e-mailed the raw GPS data to ourselves from a GPS Tracks trackline stored on Bruce's cell phone as a by-product of starting a mapping session within the software. The mailing process allowed us to choose CSV (Common Separated Value) as our export format for the attachment provided in the e-mail message. On our laptop, we downloaded the raw data file and gave the file the name: sept_14_kayak_gps.csv. Bruce opened the file in a text editor (the basic TextEdit editor that comes with a Mac operating system) and entered GPS coordinates into a Google Sheets spreadsheet for the data record provided at 35 seconds after the minute for every minute (he noticed that was the one reliable second mark throughout the file).
The result was columns A, B, and C of a Combined_Kayak_analysis.xlsx spreadsheet he exported his Google Sheet to (seen here):
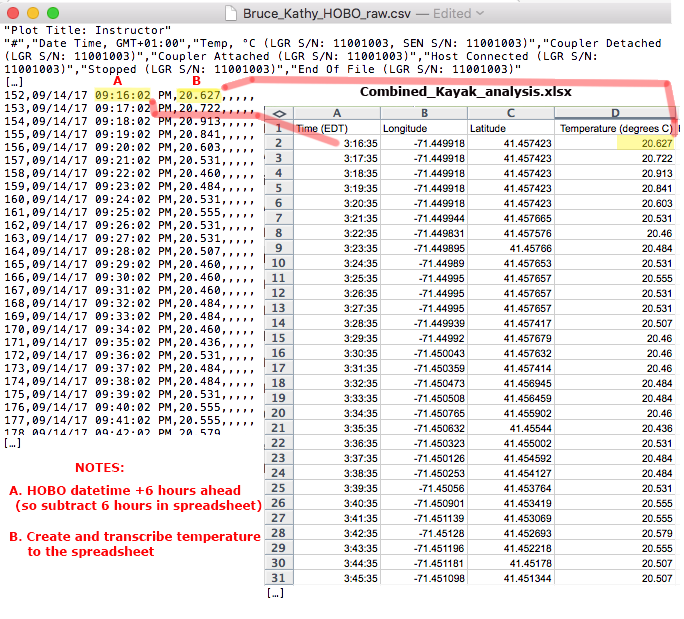
2. We used the instructions in Rob's video to download the temperature data from the HOBO thermistor that had been dragging behind our kayak. We used the HOBOware software to export the data as another CSV file and gave the file the name Bruce_Kathy_HOBO_raw.csv. Upon seeing the CSV file contents in the TextEdit text editor (seen below), Bruce realized he had not adjusted the time zone to GMT (UTC) before doing the HOBO download task (admittedly subconsciously nervous about changing the time because he was multitasking on other time-relevant documents). So, he would have to add six hours to the timestamp in the CSV file to get the appropriate timestamp for the Google Sheets analysis. He was able to do so programmatically by subtracting 1/4 of a day to each timestamp (as a separate column in the spreadsheet and then copying and pasting special to just capture the time values generated). He copied the temperature data (which was captured at the one minute intervals the HOBO was set up for - again using the instructions in Rob's video).
The result was a completion of columns A, B, C, and D in the Combined_Kayak_analysis.xls spreadsheet seen here:
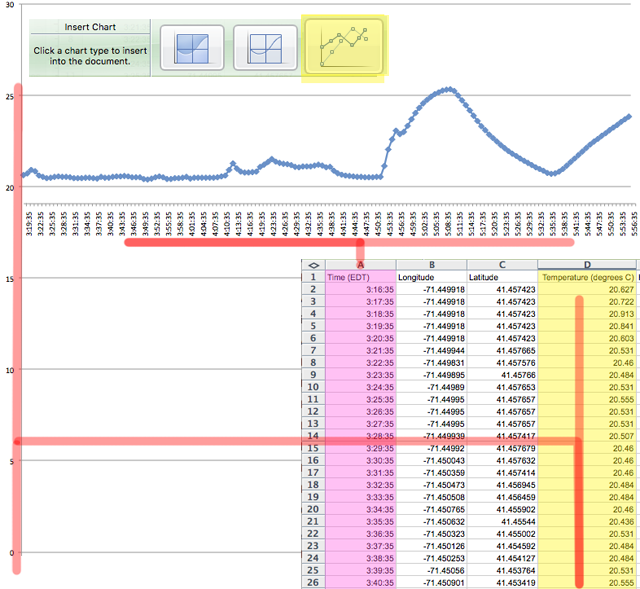
With the data set up in Google Sheets as we desired it to be, we used the Google Sheet's charting tools to create a timeseries of temperature over time. The most cumbersome task was the task of choosing the proper data ranges in the spreadsheet. After that, the chart tool did a good job of anticipating choices for formatting and axes allocation (as seen below). Since we were in eyeshot of Rob for the entire kayak trip (although typically a 100 meters or so away), our temperature track had the basic same shape as that presented in the Powerpoint presentation during class. One difference we were curious about considering was that Bruce and Kathy had used a weight to keep the HOBO submerged about five inches below the surface when standing still (it came up in the water column as we paddled with speed).
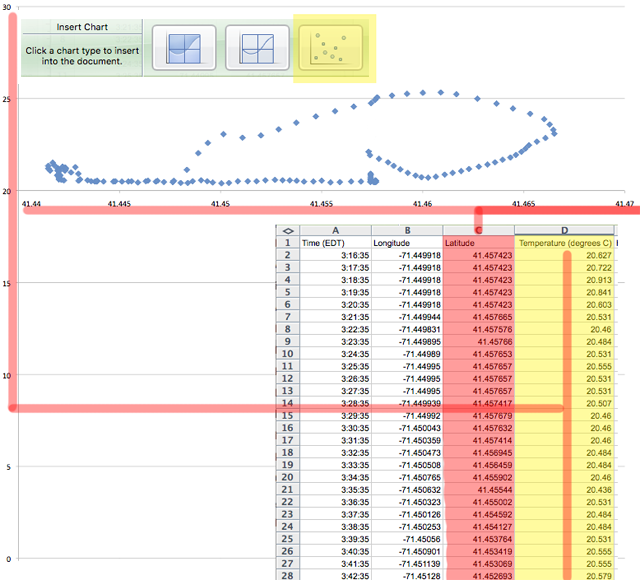
We then chose the Latitude instead of Time column data to create a scatter plot of Latitude versus Temperature. Since we were in eyeshot of Rob for the entire kayak trip (although typically a 100 meters or so away), our temperature track had the basic same shape as that presented in the Powerpoint presentation during class (except Bruce continued the analysis for the stint north to meet the other team of kayaks and back to the start). The result is seen below. We noted the same increase in temperature as we headed north, and decrease in temperature when we headed south.