

Class on October 2 2018
Jeremy provided an assignment based on the previous class where students thought about a viable food web diagram for Narragansett Bay's food web.
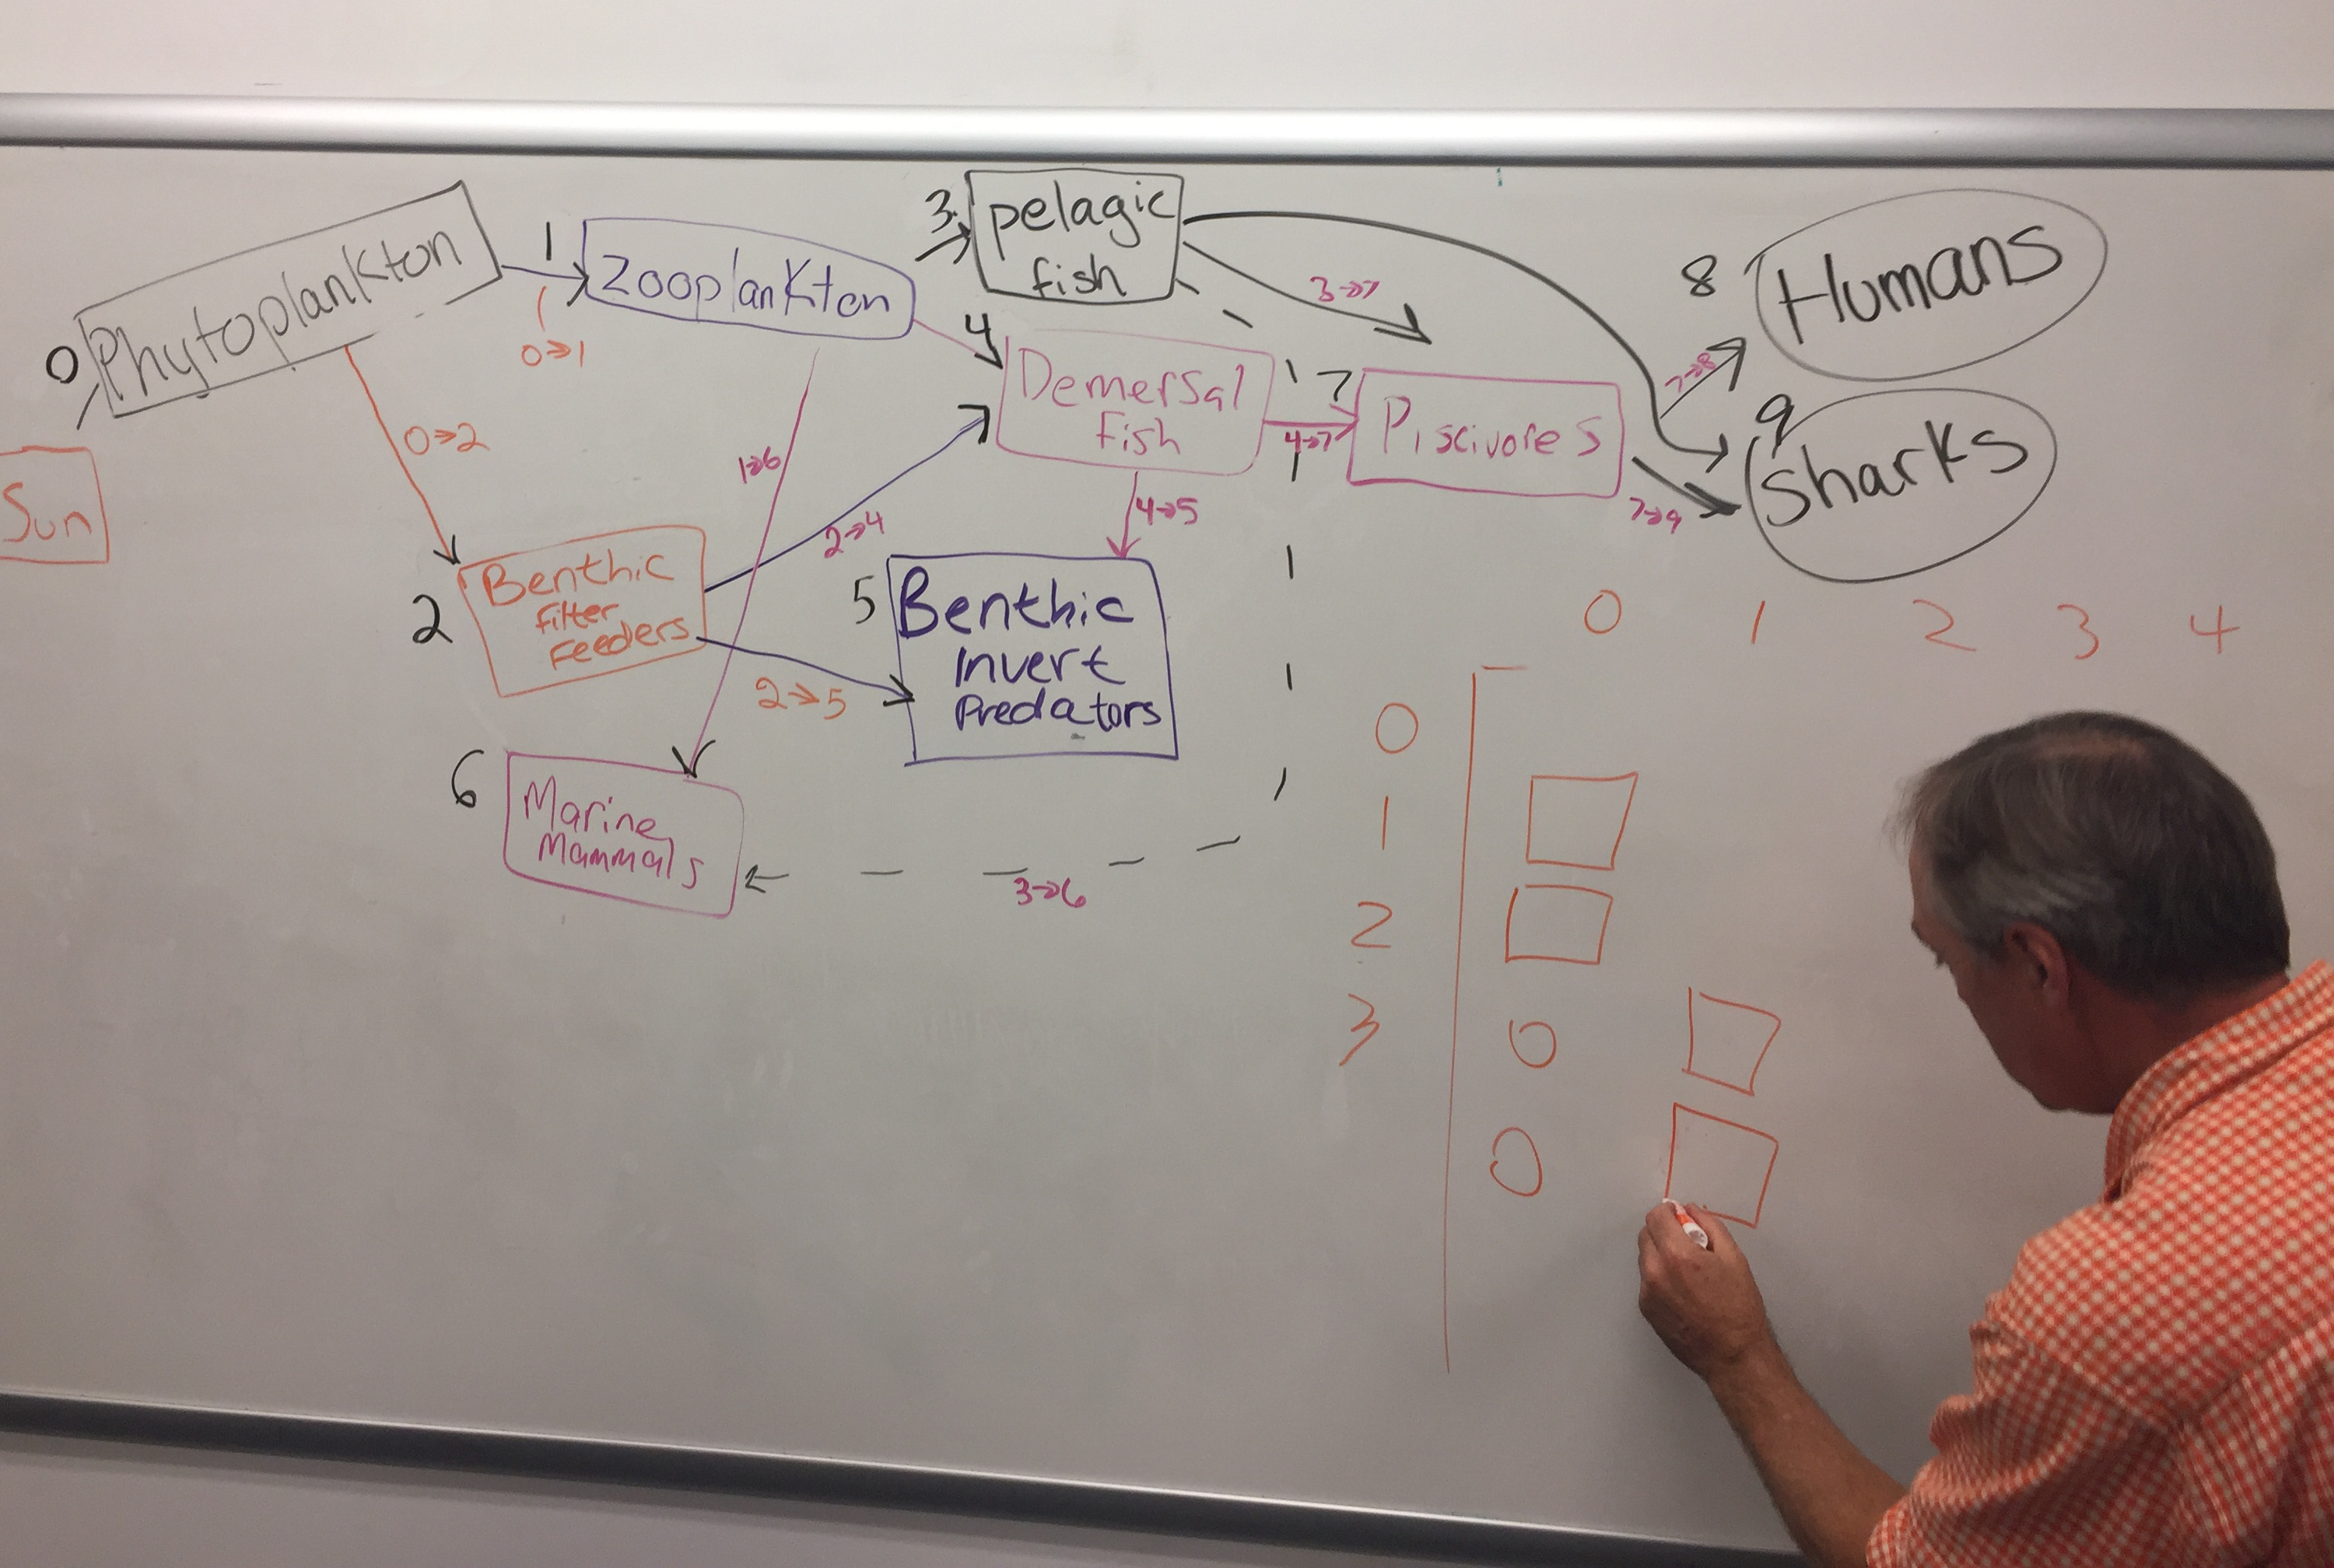
Students were asked to do another iteration upon their food web diagrams on the white board. An example from class is shown here:
Jeremy asked students to work on creating the 2x2 matrix that would support an analysis as was performed with a Jupyter Python Notebook on a simple food web model previously.
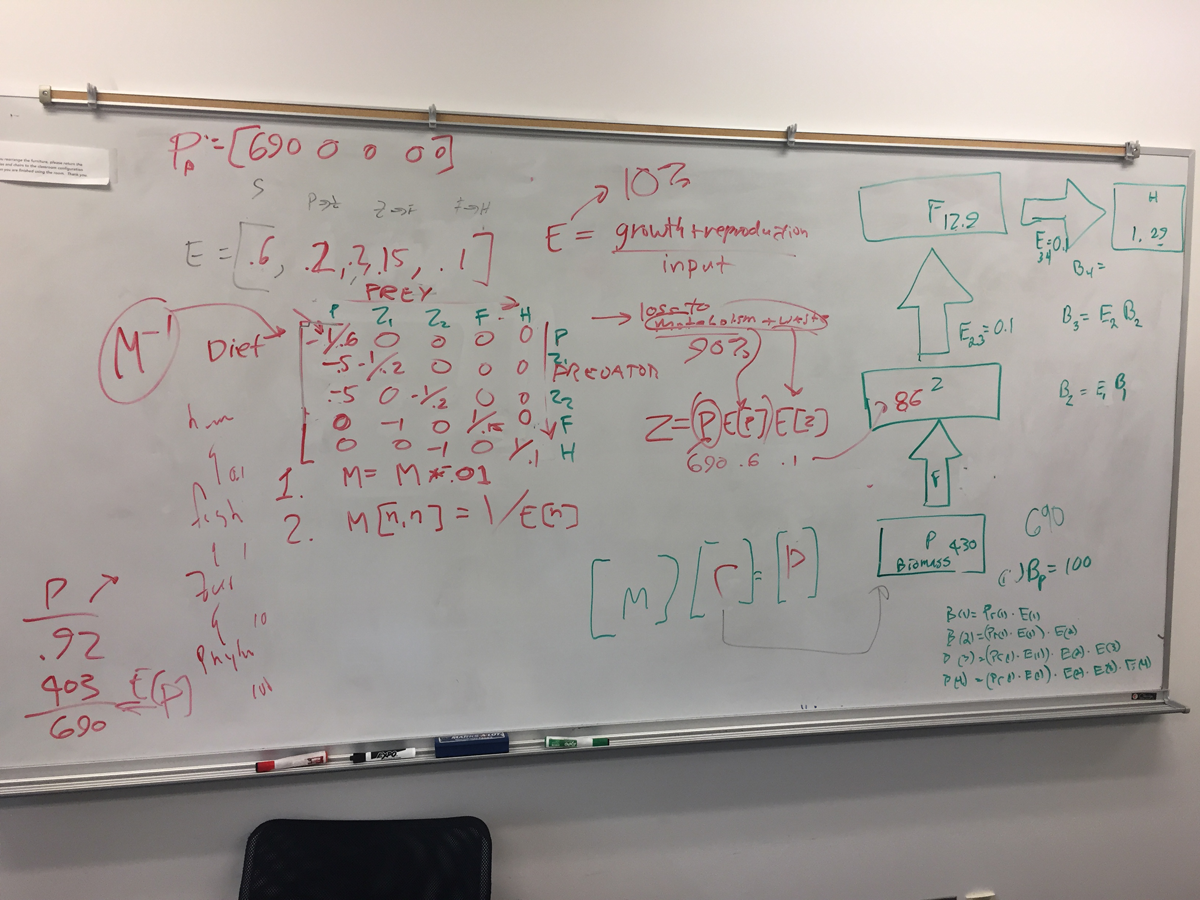
Jeremy discussed a visual method on the white board while the rest of the faculty confirmed their approach by working through the process on another white board shown here:
The process involved three steps. First, the percentages of organism predation get assigned to each arrow coming out of a box in the diagram, making sure the assigned values added up to 100% for each prey type. As an example, in this food web diagram (using the red code for each organism type):
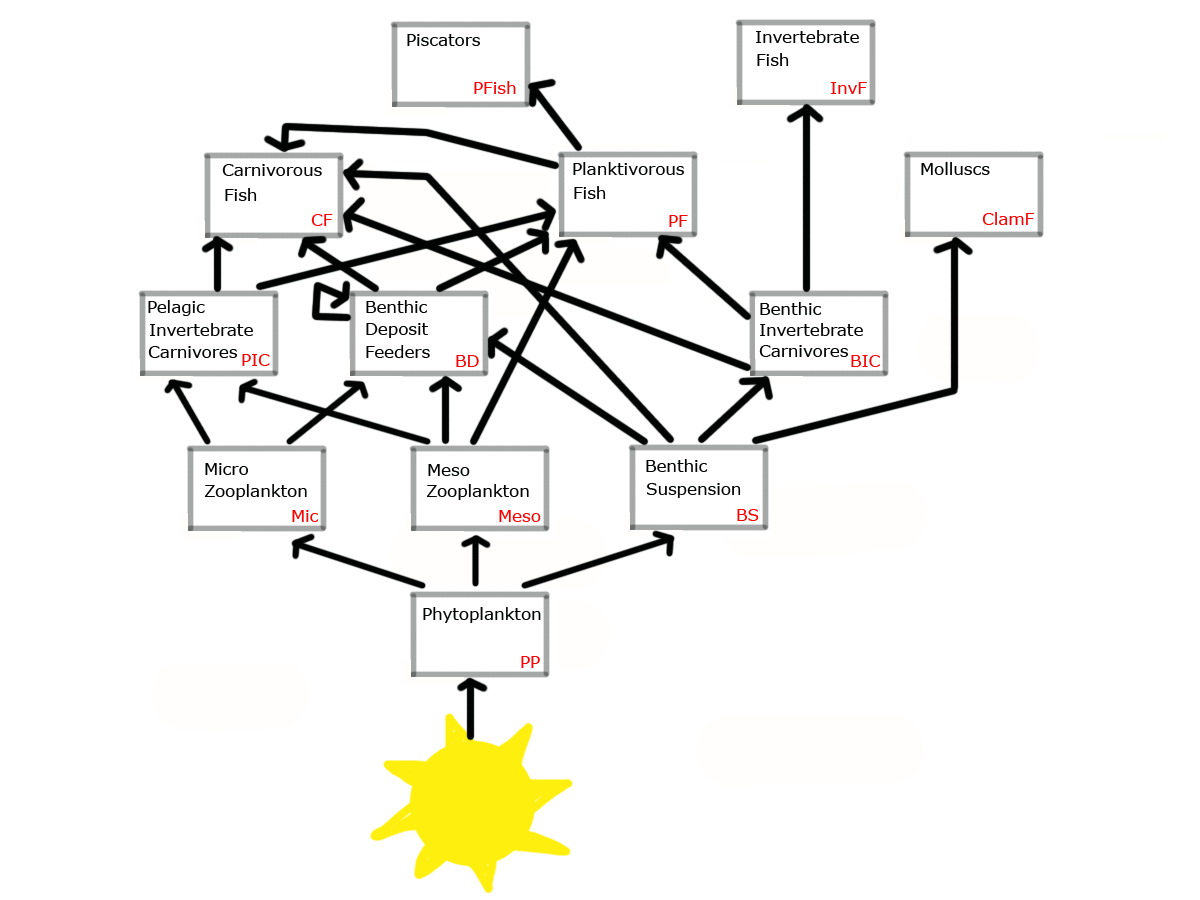
The diet for PP as prey is 65% to Mic, 28% to Meso, and 7 to BS
The diet for Mic as prey is 88% to BD and 12% to PIC
The diet for Meso as prey is 32% to BD, 47% to PIC, and 21% to PF
The diet for PIC as prey is 39% to PF and 61% to CF
The diet for BS as prey is 40% to BD, 25% to BIC, 12% to PF, and 23% to CF
The diet for BD as prey is 54% to BD, 12% to PF, and 34% to CF
The diet for BIC as prey is 26% to PF, 45% to CF, and 29% to ClamF
The diet for PF is 65% to CF, and 35% to PFish
(CF, ClamF, InF, and PFish are all apex predators so not prey to anything)
Second, each box gets assigned an energy efficiency ratio which is the ratio of all growth and reproduction use of consumed energy to overall energy consumed (energy used for metabolism or removed as waste are considered inefficient energy use).
For example, in the diagram above, we assign:
The diagonal of the matrix contains 1/E[n] (1 divided by the efficiency ratio chosen for each organism type). M[0,0] is equal to 1/.6 (so 1.67 is entered in the upper-most location in the matrix). M[1,1] is equal to 1/.24 (so 4.167 is entered in the next diagonal location, top-down and left-to-right, in the matrix. Using the example food web above, the values are shown in light blue here:
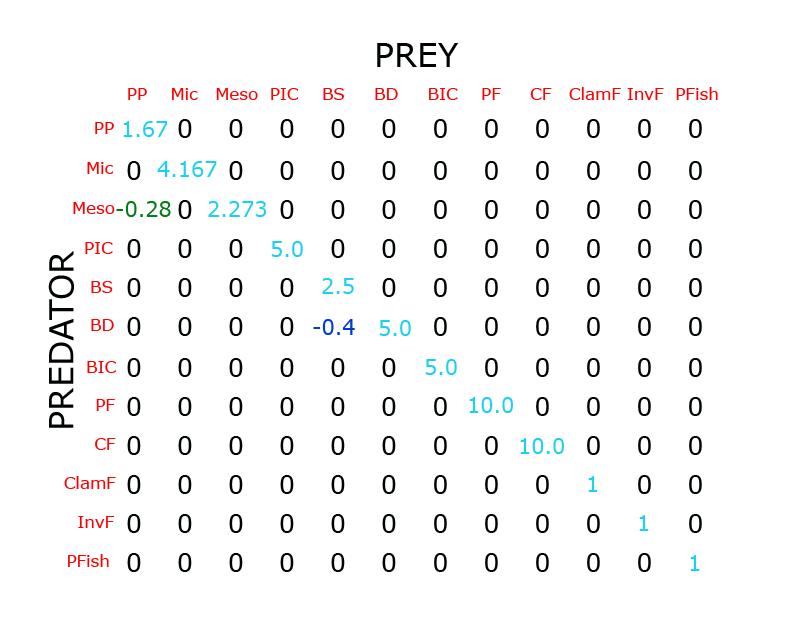
The diet percentages are then used to represent the predation of prey for each diet relationship. In the image above, we put -0.28 into the location in the matrix that represents where PP is preyed upon by the Meso predator (in green above). Meso Zooplankton is taking 28 percent of available Phytoplankton energy as food. Similarly, the dark blue -0.4 represents where BD is feeding upon BS (since BD consumes 40% of available BS energy). Continuing in this manner, we end up with a 12x12 matrix seen in the image here:
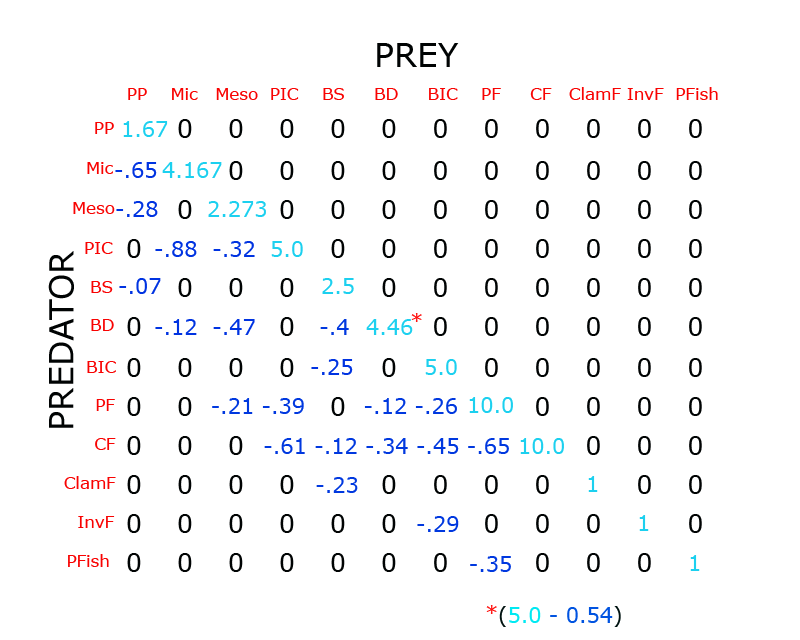
Note that the 4.46 shown in the middle of the matrix, with the red asterisk, represents the 5.0 efficiency-related value plus the -.54 representation of BD organisms consuming 54% of all available BD energy as food (organisms within the BD type feeding upon other organisms within the BD type).
Students were asked to create Food Web reports based on a format sent to them via e-mail by Rob. Students would participate in a report discussion at the next class period.
Students were asked to do another iteration upon their food web diagrams on the white board. An example from class is shown here:
Jeremy asked students to work on creating the 2x2 matrix that would support an analysis as was performed with a Jupyter Python Notebook on a simple food web model previously.
Jeremy discussed a visual method on the white board while the rest of the faculty confirmed their approach by working through the process on another white board shown here:
The process involved three steps. First, the percentages of organism predation get assigned to each arrow coming out of a box in the diagram, making sure the assigned values added up to 100% for each prey type. As an example, in this food web diagram (using the red code for each organism type):
The diet for PP as prey is 65% to Mic, 28% to Meso, and 7 to BS
The diet for Mic as prey is 88% to BD and 12% to PIC
The diet for Meso as prey is 32% to BD, 47% to PIC, and 21% to PF
The diet for PIC as prey is 39% to PF and 61% to CF
The diet for BS as prey is 40% to BD, 25% to BIC, 12% to PF, and 23% to CF
The diet for BD as prey is 54% to BD, 12% to PF, and 34% to CF
The diet for BIC as prey is 26% to PF, 45% to CF, and 29% to ClamF
The diet for PF is 65% to CF, and 35% to PFish
(CF, ClamF, InF, and PFish are all apex predators so not prey to anything)
Second, each box gets assigned an energy efficiency ratio which is the ratio of all growth and reproduction use of consumed energy to overall energy consumed (energy used for metabolism or removed as waste are considered inefficient energy use).
For example, in the diagram above, we assign:
      PP    Mic   Meso  PIC   BS    BD    BIC   PF    CF  ClamF  InvF  PFish
E= [ 0.60, 0.24, 0.44, 0.20, 0.40, 0.20, 0.20, 0.10, 0.10,  1,    1,     1 ]
Third, the 2x2 matrix (with dimensions of number-of-organism-types by number-of-organism-types) is filled out.
The diagonal of the matrix contains 1/E[n] (1 divided by the efficiency ratio chosen for each organism type). M[0,0] is equal to 1/.6 (so 1.67 is entered in the upper-most location in the matrix). M[1,1] is equal to 1/.24 (so 4.167 is entered in the next diagonal location, top-down and left-to-right, in the matrix. Using the example food web above, the values are shown in light blue here:
The diet percentages are then used to represent the predation of prey for each diet relationship. In the image above, we put -0.28 into the location in the matrix that represents where PP is preyed upon by the Meso predator (in green above). Meso Zooplankton is taking 28 percent of available Phytoplankton energy as food. Similarly, the dark blue -0.4 represents where BD is feeding upon BS (since BD consumes 40% of available BS energy). Continuing in this manner, we end up with a 12x12 matrix seen in the image here:
Note that the 4.46 shown in the middle of the matrix, with the red asterisk, represents the 5.0 efficiency-related value plus the -.54 representation of BD organisms consuming 54% of all available BD energy as food (organisms within the BD type feeding upon other organisms within the BD type).
Students were asked to create Food Web reports based on a format sent to them via e-mail by Rob. Students would participate in a report discussion at the next class period.