

Class on September 27 2018
Jeremy led a discussion of Narragansett Bay and an interactive white board session of componentizing a Narragansett Bay food web for modeling via Python the following week.
Narragansett Bay has 196 square miles of estuary and 560 miles of coast. It inclues 3321 acres of salt marsh and 513 acres of seagrass.
The main nutrients historically and currently are NH4 (Ammonium), N02 (Nitrogen Dioxide), NO3 (Nitrate), and PO4 (Phosphate). The nitrogen nutrients are typically the limiting nutrients for most of the food web in Narragansett Bay (phytoplankton as primary producers) but phosphorous nutrients are often limiting for algae.
Narragansett Bay has experienced two dramatic fish kills that have demanded reponses to water conditions. A 1898 fish kill in the Providence Bay led to the creation of the Fields Point water treatment plant. A 2003 fish kill in Greenwich Bay led to an improved Combined Sewer Outfall for the bay. As a result of the new CSO tunnel being put into service in 2012:
As of today, 1,221 unique taxa of benthic invertebrates have been identified in Narragansett Bay which is an estimated 80% of the total living.
The three major issues concerning Narragansett Bay are 1) euthrophication causing benthic kills from anoxia and hypoxia conditions that develop, 2) heavy metals in the sediments of Naragansett Bay and their leaching, and 3) petroleum hydrocarbons lingering in the bay.
Jeremy reviewed trawl data for decades worth of weekly trawls off Fox Island in the inner bay and off Whale Island in the outer bay. A general trend is a decline in the colder water fish and an increase in warmer water fish. Migrating fish can respond by moving to colder, northern waters while local residents often cannot escape through migrations (lobster, and cancer crab for example).
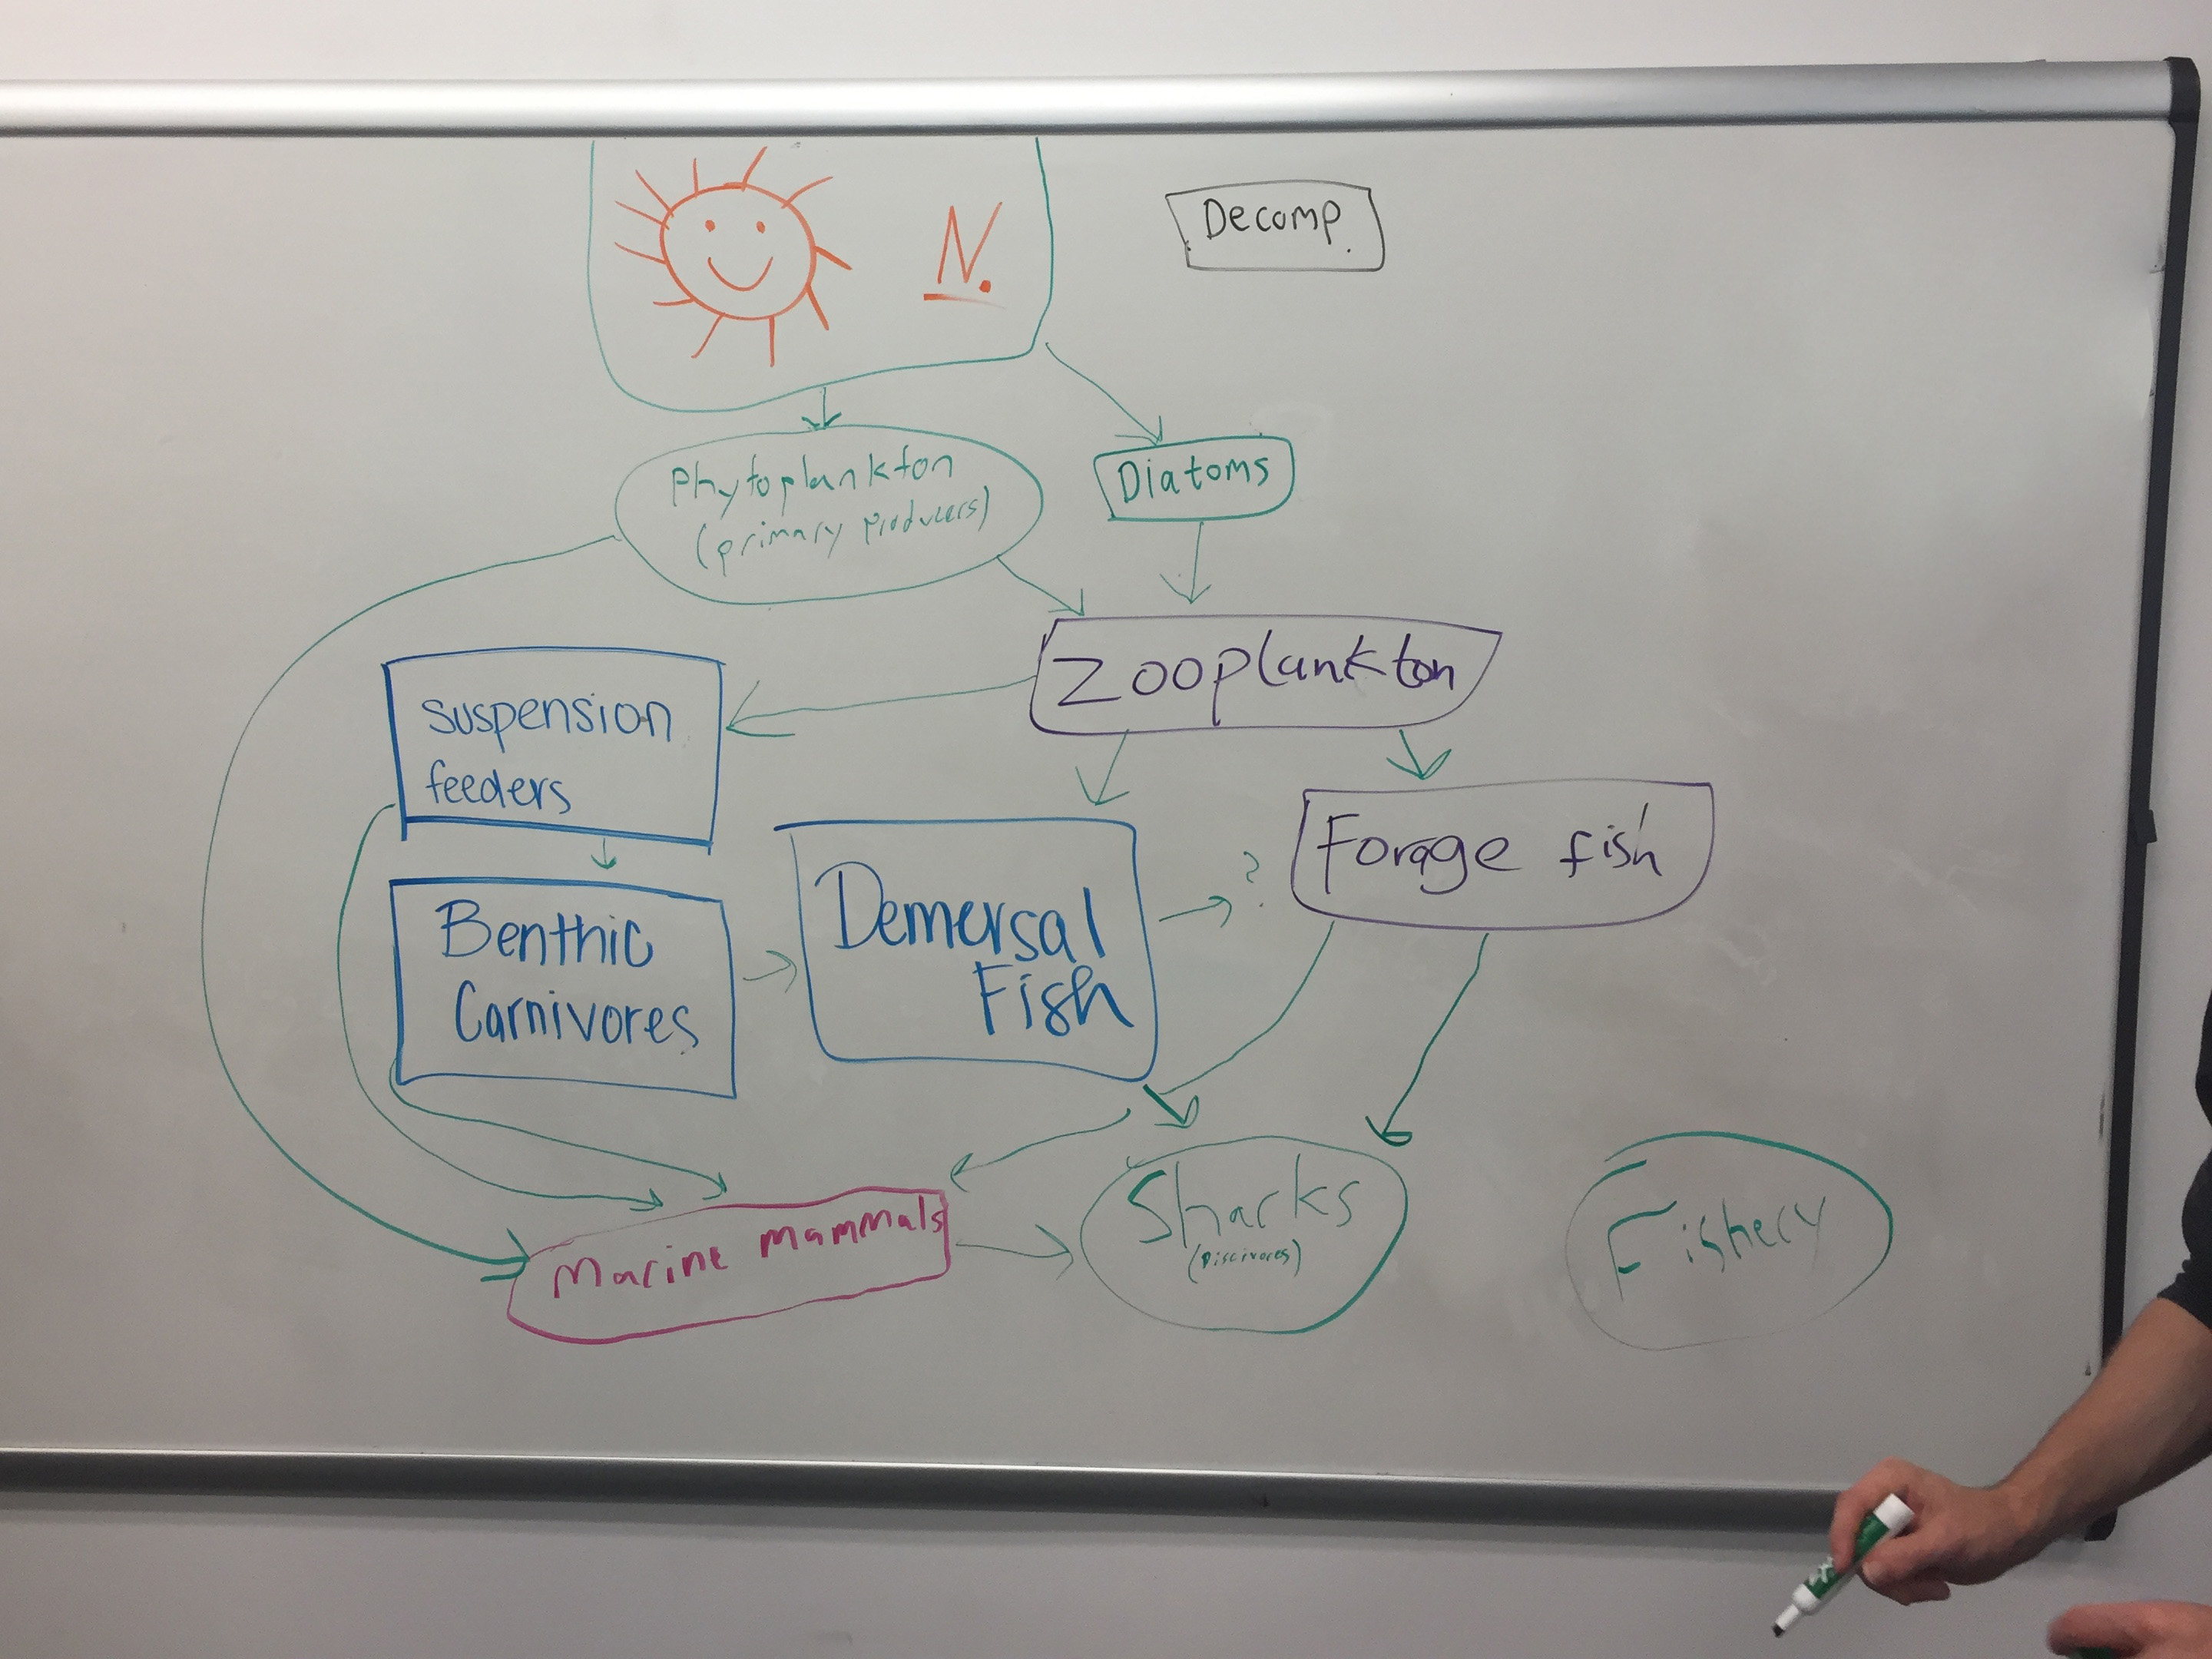
A student team discussed the Narragansett Food web and came up with the following categorized food web on their white board:
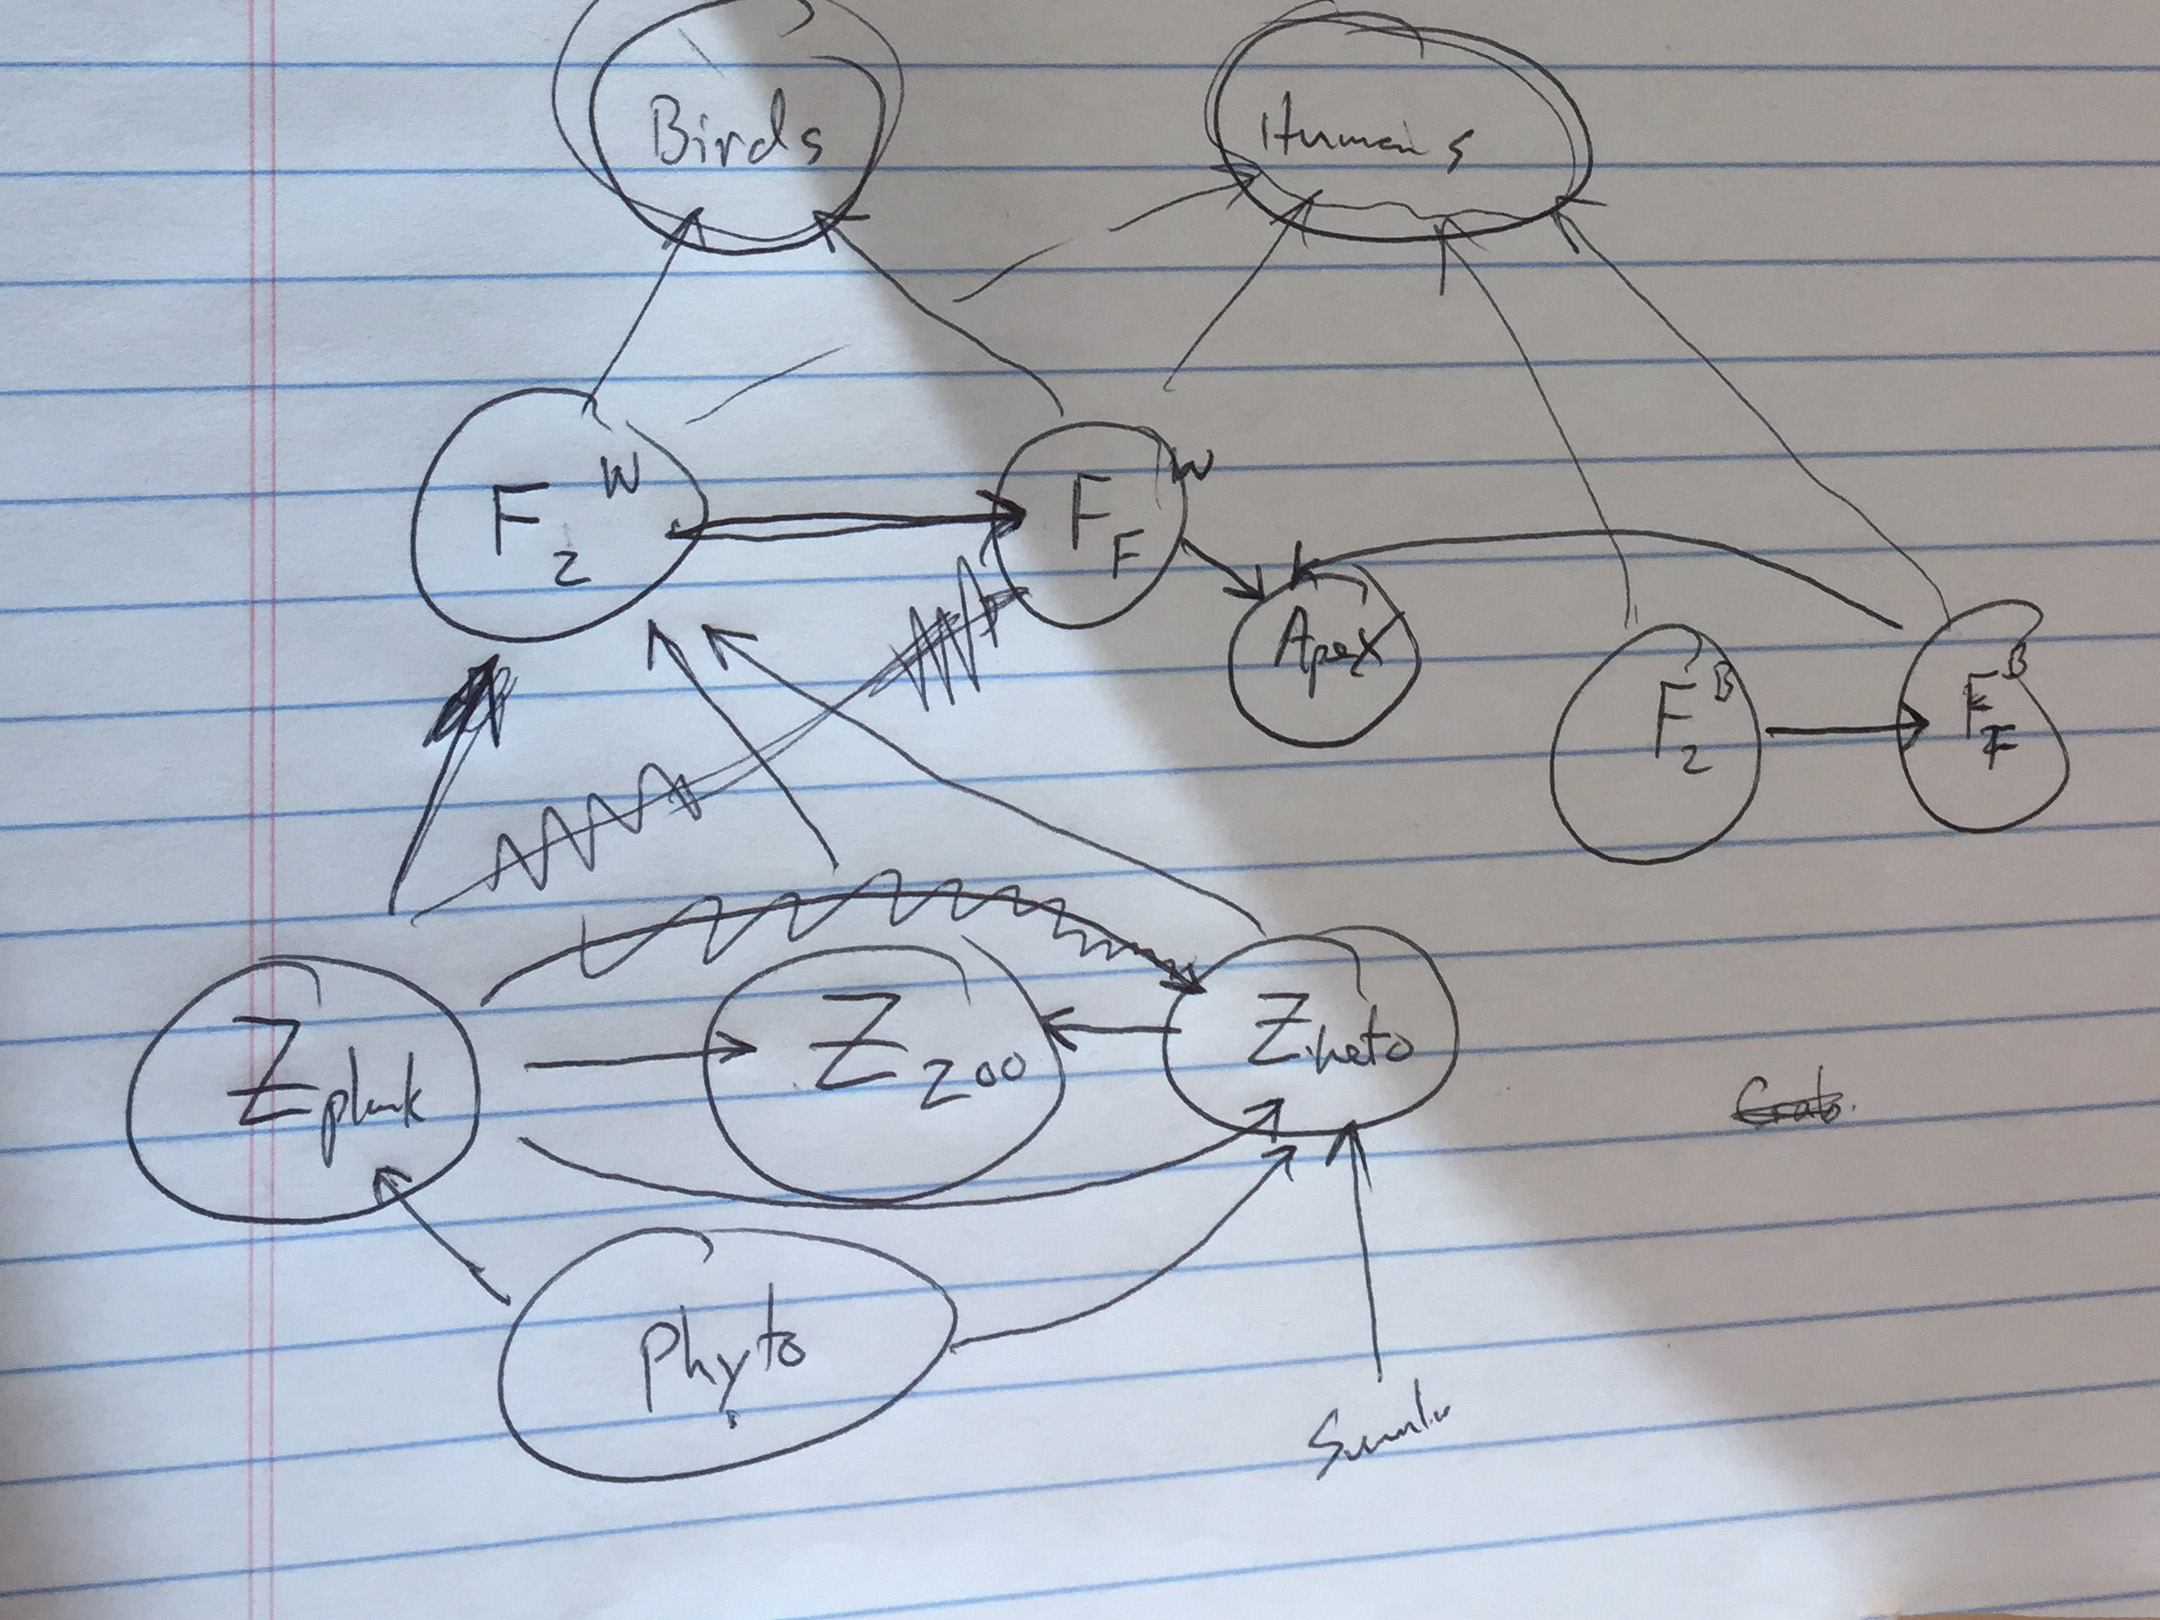
The faculty team discussed the Narragansett Food web and came up with the following categorized food web on their white board (transferred to paper to take with us):
Jeremy referred the class to a 1997 paper by Mark Monaco and Robert Ulanowicz. They created componentized food web diagrams for Narragansett Bay, Chesapeake Bay, and the Delaware Bay. Their Narragansett Bay web looks like:
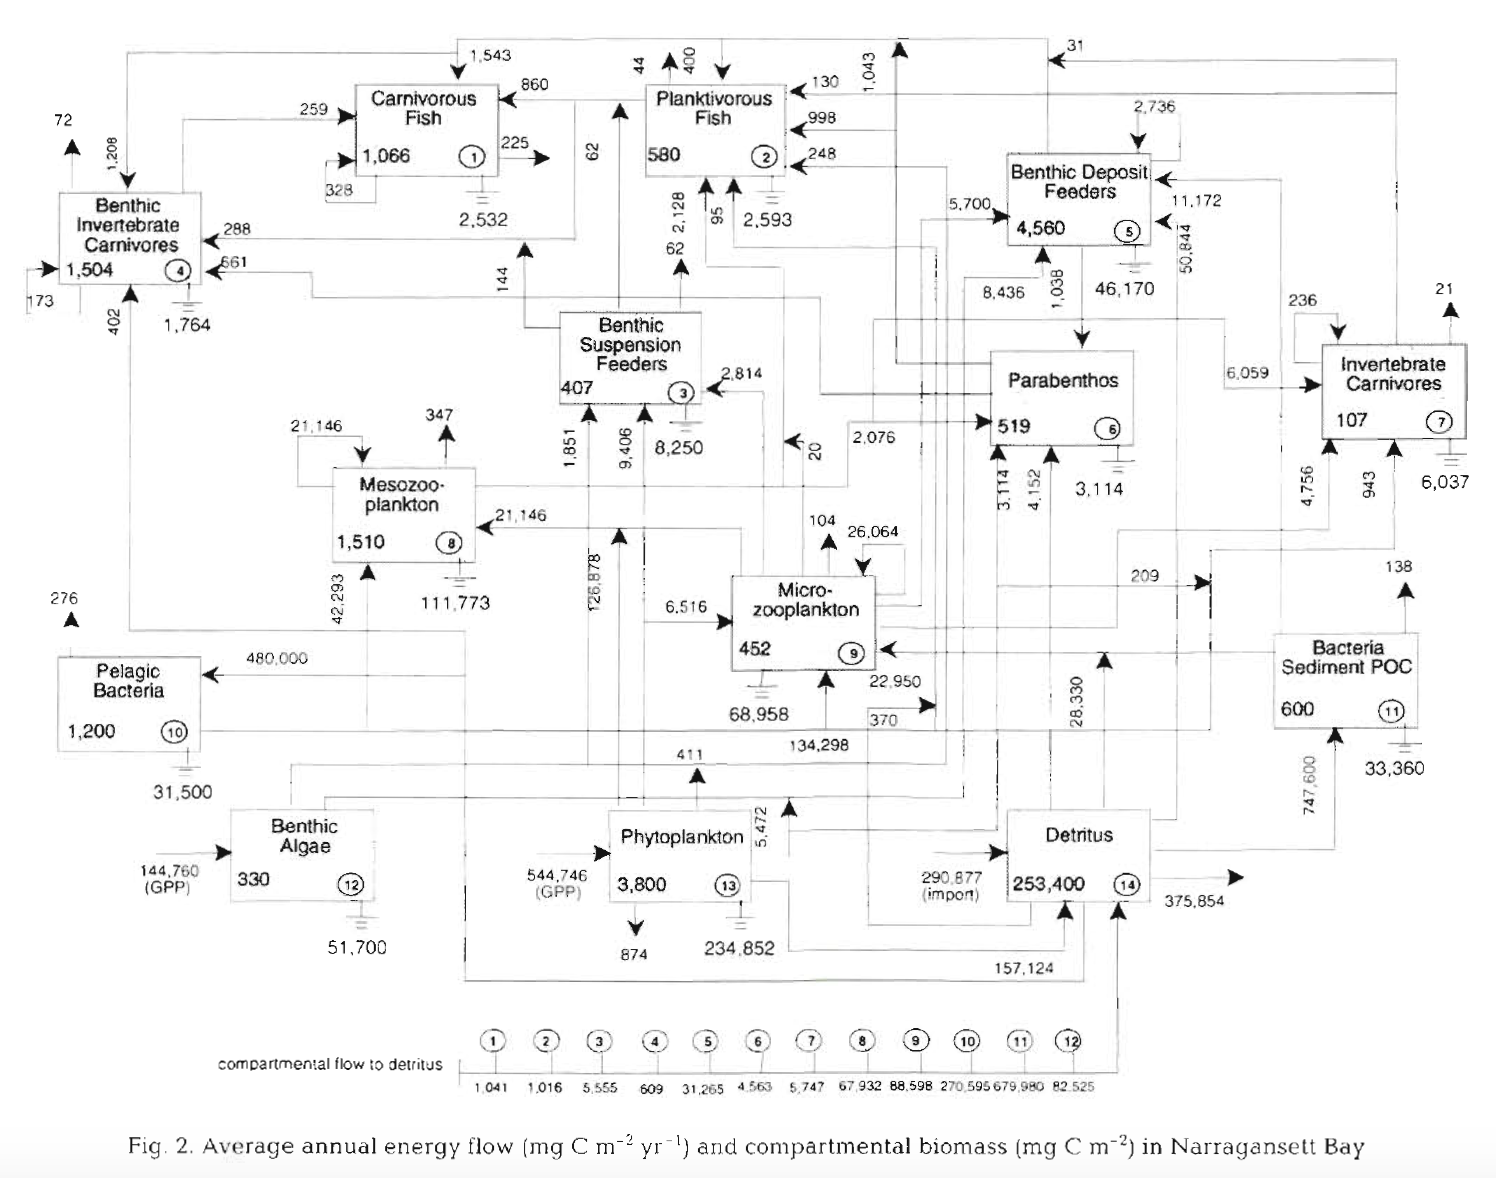
Students were asked to consider the diagram above in terms of how the diagram could be used to program an efficiency model like the simpler model we created last week. The Byron_etal_2011.pdf resource on Sakai (in the Module 1 folder) provides additional useful context for thinking about the Narragansett Bay food web.
Narragansett Bay has 196 square miles of estuary and 560 miles of coast. It inclues 3321 acres of salt marsh and 513 acres of seagrass.
The main nutrients historically and currently are NH4 (Ammonium), N02 (Nitrogen Dioxide), NO3 (Nitrate), and PO4 (Phosphate). The nitrogen nutrients are typically the limiting nutrients for most of the food web in Narragansett Bay (phytoplankton as primary producers) but phosphorous nutrients are often limiting for algae.
Narragansett Bay has experienced two dramatic fish kills that have demanded reponses to water conditions. A 1898 fish kill in the Providence Bay led to the creation of the Fields Point water treatment plant. A 2003 fish kill in Greenwich Bay led to an improved Combined Sewer Outfall for the bay. As a result of the new CSO tunnel being put into service in 2012:
- Nutrients are down 50% in the upper bay
- Primary production is down 30% in the upper bay
- Winter-Spring Diatom blooms are down
- Benthic species diversity is up
As of today, 1,221 unique taxa of benthic invertebrates have been identified in Narragansett Bay which is an estimated 80% of the total living.
The three major issues concerning Narragansett Bay are 1) euthrophication causing benthic kills from anoxia and hypoxia conditions that develop, 2) heavy metals in the sediments of Naragansett Bay and their leaching, and 3) petroleum hydrocarbons lingering in the bay.
Jeremy reviewed trawl data for decades worth of weekly trawls off Fox Island in the inner bay and off Whale Island in the outer bay. A general trend is a decline in the colder water fish and an increase in warmer water fish. Migrating fish can respond by moving to colder, northern waters while local residents often cannot escape through migrations (lobster, and cancer crab for example).
A student team discussed the Narragansett Food web and came up with the following categorized food web on their white board:
The faculty team discussed the Narragansett Food web and came up with the following categorized food web on their white board (transferred to paper to take with us):
Jeremy referred the class to a 1997 paper by Mark Monaco and Robert Ulanowicz. They created componentized food web diagrams for Narragansett Bay, Chesapeake Bay, and the Delaware Bay. Their Narragansett Bay web looks like:
Students were asked to consider the diagram above in terms of how the diagram could be used to program an efficiency model like the simpler model we created last week. The Byron_etal_2011.pdf resource on Sakai (in the Module 1 folder) provides additional useful context for thinking about the Narragansett Bay food web.