

Class on November 29, 2018
Chris presented work on modeling Narragansett Bay currents and NPZD that he and graduate students had performed in the past. The focus was on considering spatial and temporal resolution in the NPZ models
student groups presented during the previous class period.
Chris' modeling work got a funding boost when a significant fish kill event occured in Greenwich Bay in 2003. Residents wanted answers as to how such a fish kill event could occur. Many assumed the culprit was the conditions in the very urban Providence River where it was known that nutrient loads were high, even after work had begun to mitigate those levels. Chris asked students to make a list of likely nutrient sources to the model, and the class ordered the suggestions as if playing The Family Feud:
Chris asked for the main processes responsible for a fish kill and Erin responded with Nutrient Load to Phytoplankton Uptake to Mortality Detritus to Detritavor Bacteria using up the oxygen in their respiration.
The class nodded in agreement with that feasible chain of events.
Chris gave an overview of the bathymetry of Greenwich Bay and prevailing wind conditions (both of which were known to be participatory in the fish kill).
Chris explained the 3-legged stool approach to modeling he used:
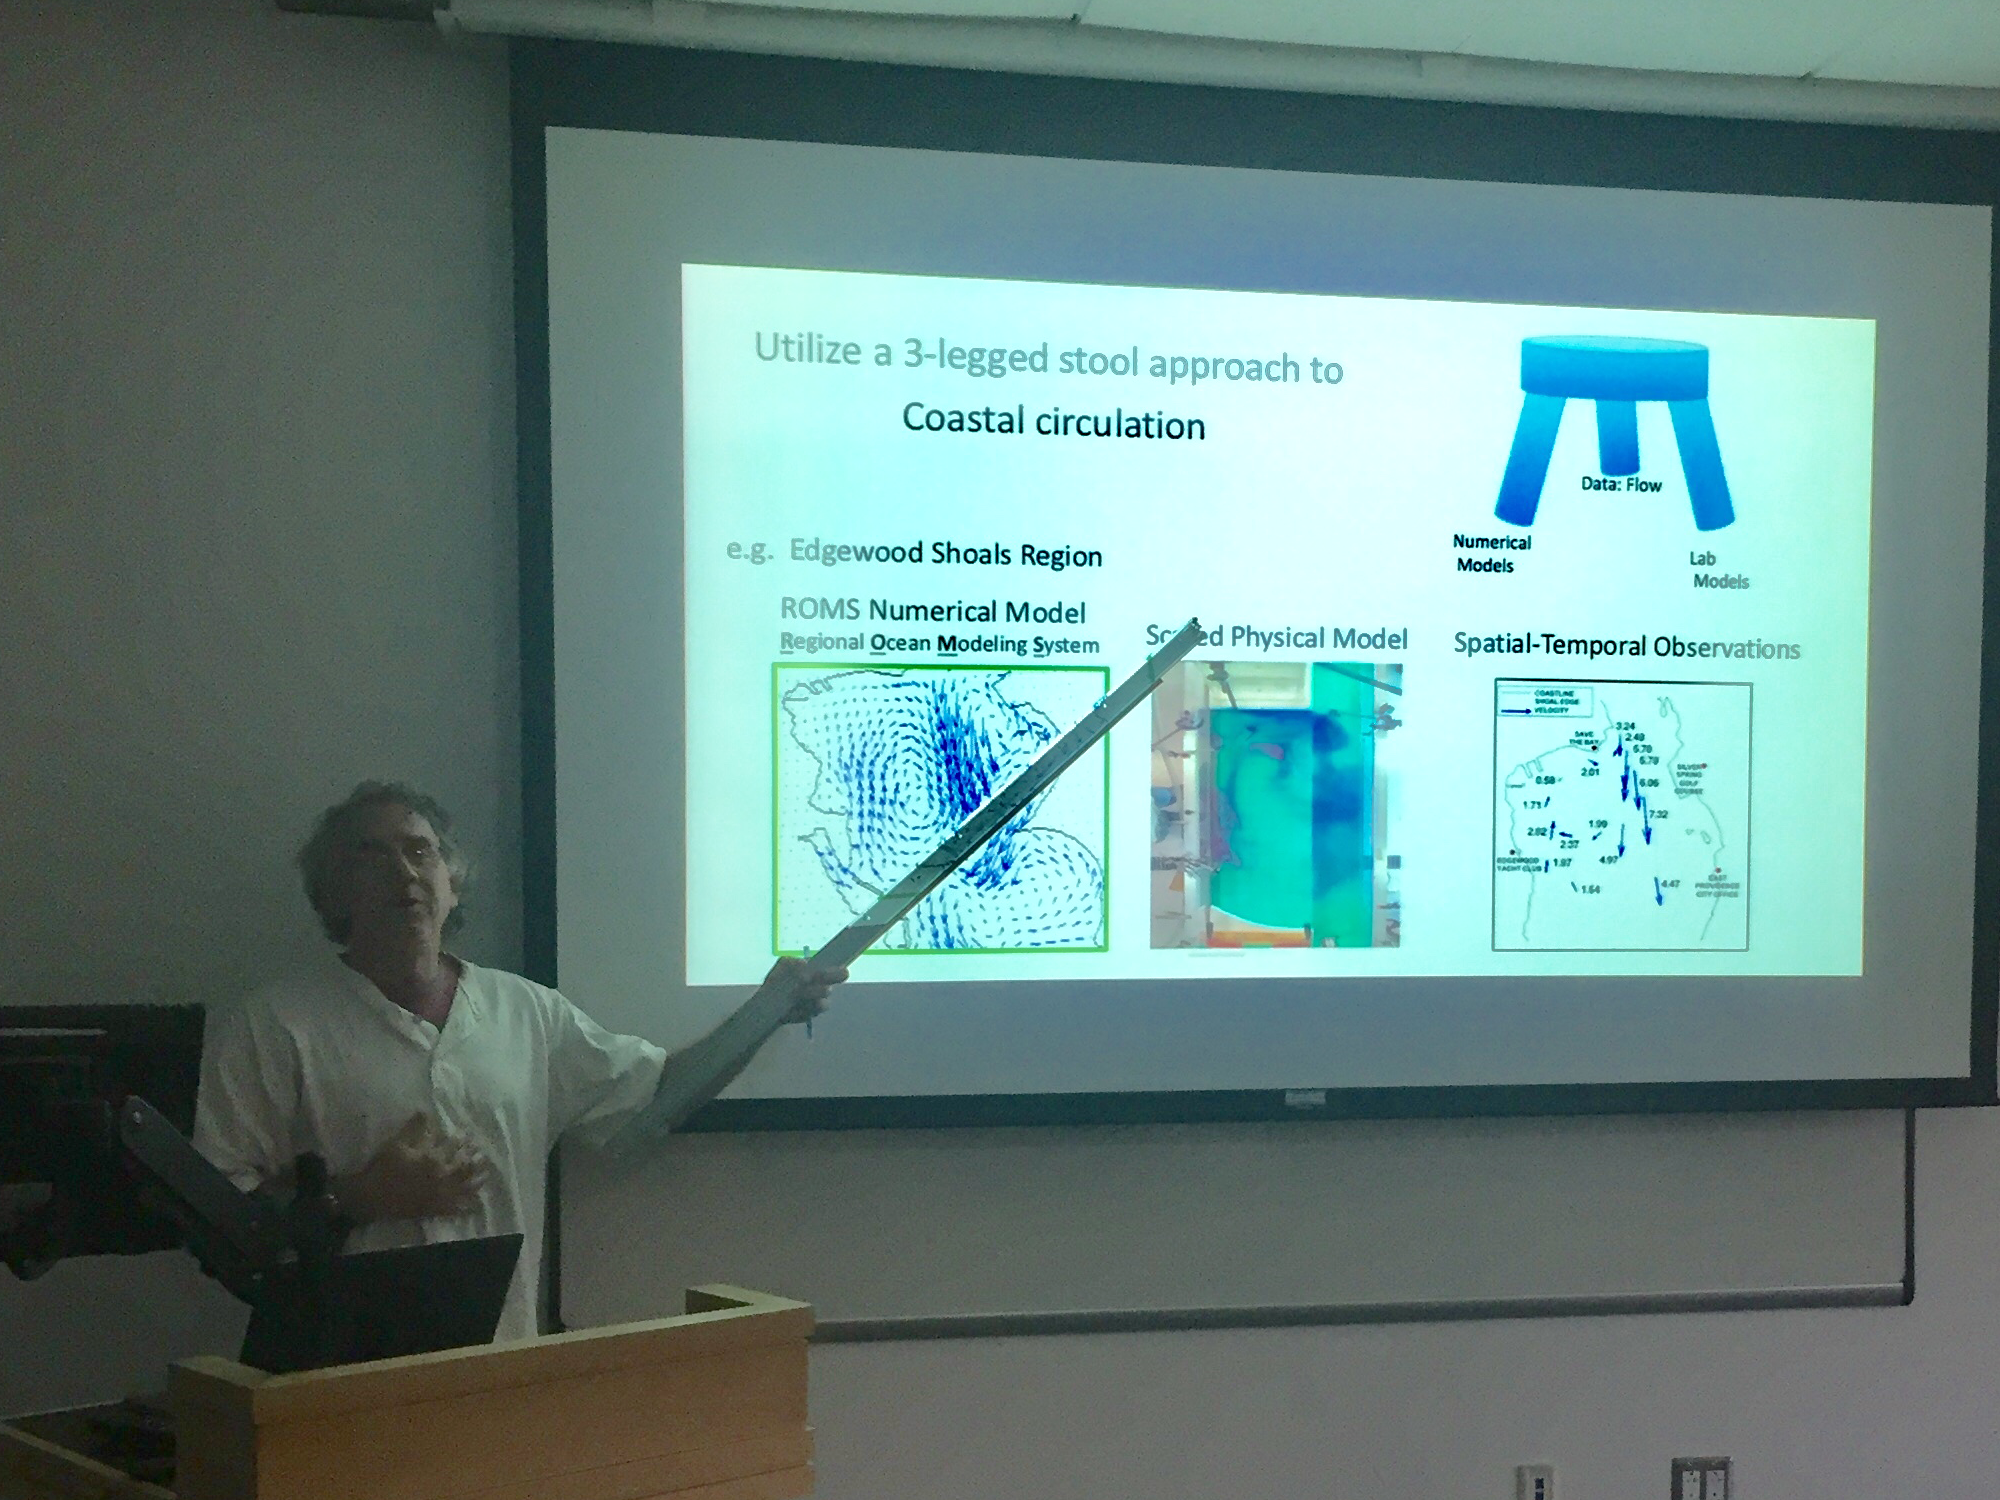
He provided a historical perspective on the iterations of models over time. Initial models attempted to simulate the movement of nitrogen in the upper bay from contributions coming out of the five main rivers that flow into the bay. The Insomniacs helped him groundtruth the state of nitrogen in the bay (see http://www.geo.brown.edu/georesearch/insomniacs/) by taking many measurements over time (seasonal and tidal cycles).
The Narragansett Bay Commission funded ten years worth of modeling effort to help ascertain the affect of Fields Point and Bucklin Point waste water treatment facilities.
With a physical nitrogen model in place, Chris evolved the 3-legged approach with a mass-conservative ROMS model (ocean circulation) for Narragansett Bay. The spatial-temporal observations were provided by many different drifters (some cheap and some as expensive as $35,000 each).
With a ROMS model in place, the next modeling efforts looked to simulate a chemical dye being discharged from both the Fields Point wastewater facility location and the Edgewood Shoals (the location of a circulation gyre, also north of Greenwich Bay but not as far north as Providence). Blackstone River and Taunton River nitrogen contribution simulation was monitored as well. The model showed simulated dye from the Taunton river ending up in the Providence River — brought there by a current coming up and around from the East Passage of the bay.
More sophistication was then added with forcing wind inputs, additional physical variables, and biological NPZD model integration. The movement of the dyes changed with wind direction but still ended up north of Greenwich Bay in Edgewood Shoals and the Providence River. The currents then carried phytoplankton north as well but the phytoplankton blooms were significantly less when Greenwich Bay was eliminated from the bathymetric model.
Next steps for improving the model include a better zooplankton component (to model their grazing of phytoplankton) and better mixing and turbulence simulation of bay waters. To quell a phytoplankton bloom, zooplankton need to come from the mid-bay. Especially when northwest winds cause the larger phytoplankton blooms. The timing of zooplankton arrival seems to be critical. A delay of more than three days lets a phytoplankton bloom explode.
Chris opened the discussion to questions and comments regarding the presentation.
We asked why the Providence River isn't the main location for phytoplankton to bloom and were asked to think about the turbidity of the water (which suppresses light from getting into the water column). The freshwater component also changes salinity whereas Greenwich Bay is clear and shallow — much more conducive to phytoplankton.
We found out that some of the gyres are caused by manmade objects (bridges) and dredging activities (done for shipping purposes).
We found out that model suggests the efforts to reduce the nitrogen load in the Providence River from 15 milligrams/liter to between 5 and 7 had a significant impact in reducing phytoplankton blooms but further efforts (down to 3 mG/l or less) are likely to have a very minor impact. That suggests that non-point sources are the best place to focus perhaps.
We learned that the Narragansett Bay Commission is the quasi-private facility that has the ability (and accountability) to make the bay healthy for public requirements. They fund capital improvement projects by increasing rates for sewer service and other services they provide regularly (residentially and commercially).
We learned the ROMS software allows the modeler to plug-in one of a few different popular NPZ models (Franks included), but that the equations we have used in class are supplemented by specific equations to simulate detritus as one or more components.

Chris asked that students think about the context of the lecture in terms what would be required of the models they created for project 2 in order to add a spatial consideration.
Chris provided a series of animations from modeling runs so we could explore the outputs of his latest modeling efforts. For example, this phytoplankton simulation over twenty days.
Chris' modeling work got a funding boost when a significant fish kill event occured in Greenwich Bay in 2003. Residents wanted answers as to how such a fish kill event could occur. Many assumed the culprit was the conditions in the very urban Providence River where it was known that nutrient loads were high, even after work had begun to mitigate those levels. Chris asked students to make a list of likely nutrient sources to the model, and the class ordered the suggestions as if playing The Family Feud:
- Waste water sewage
- Fertilizer run-off
- Leaking septic tanks and cesspools
- Churned up detritus from the benthos
- Bird and other animal poop
- Ground water
- Ocean circulation
- Atmospheric deposition
- Cyanobacteria and other primary fixers of inorganic Nitrogen
Chris asked for the main processes responsible for a fish kill and Erin responded with Nutrient Load to Phytoplankton Uptake to Mortality Detritus to Detritavor Bacteria using up the oxygen in their respiration.
The class nodded in agreement with that feasible chain of events.
Chris gave an overview of the bathymetry of Greenwich Bay and prevailing wind conditions (both of which were known to be participatory in the fish kill).
Chris explained the 3-legged stool approach to modeling he used:
He provided a historical perspective on the iterations of models over time. Initial models attempted to simulate the movement of nitrogen in the upper bay from contributions coming out of the five main rivers that flow into the bay. The Insomniacs helped him groundtruth the state of nitrogen in the bay (see http://www.geo.brown.edu/georesearch/insomniacs/) by taking many measurements over time (seasonal and tidal cycles).
The Narragansett Bay Commission funded ten years worth of modeling effort to help ascertain the affect of Fields Point and Bucklin Point waste water treatment facilities.
With a physical nitrogen model in place, Chris evolved the 3-legged approach with a mass-conservative ROMS model (ocean circulation) for Narragansett Bay. The spatial-temporal observations were provided by many different drifters (some cheap and some as expensive as $35,000 each).
With a ROMS model in place, the next modeling efforts looked to simulate a chemical dye being discharged from both the Fields Point wastewater facility location and the Edgewood Shoals (the location of a circulation gyre, also north of Greenwich Bay but not as far north as Providence). Blackstone River and Taunton River nitrogen contribution simulation was monitored as well. The model showed simulated dye from the Taunton river ending up in the Providence River — brought there by a current coming up and around from the East Passage of the bay.
More sophistication was then added with forcing wind inputs, additional physical variables, and biological NPZD model integration. The movement of the dyes changed with wind direction but still ended up north of Greenwich Bay in Edgewood Shoals and the Providence River. The currents then carried phytoplankton north as well but the phytoplankton blooms were significantly less when Greenwich Bay was eliminated from the bathymetric model.
Next steps for improving the model include a better zooplankton component (to model their grazing of phytoplankton) and better mixing and turbulence simulation of bay waters. To quell a phytoplankton bloom, zooplankton need to come from the mid-bay. Especially when northwest winds cause the larger phytoplankton blooms. The timing of zooplankton arrival seems to be critical. A delay of more than three days lets a phytoplankton bloom explode.
Chris opened the discussion to questions and comments regarding the presentation.
We asked why the Providence River isn't the main location for phytoplankton to bloom and were asked to think about the turbidity of the water (which suppresses light from getting into the water column). The freshwater component also changes salinity whereas Greenwich Bay is clear and shallow — much more conducive to phytoplankton.
We found out that some of the gyres are caused by manmade objects (bridges) and dredging activities (done for shipping purposes).
We found out that model suggests the efforts to reduce the nitrogen load in the Providence River from 15 milligrams/liter to between 5 and 7 had a significant impact in reducing phytoplankton blooms but further efforts (down to 3 mG/l or less) are likely to have a very minor impact. That suggests that non-point sources are the best place to focus perhaps.
We learned that the Narragansett Bay Commission is the quasi-private facility that has the ability (and accountability) to make the bay healthy for public requirements. They fund capital improvement projects by increasing rates for sewer service and other services they provide regularly (residentially and commercially).
We learned the ROMS software allows the modeler to plug-in one of a few different popular NPZ models (Franks included), but that the equations we have used in class are supplemented by specific equations to simulate detritus as one or more components.
Chris asked that students think about the context of the lecture in terms what would be required of the models they created for project 2 in order to add a spatial consideration.
Chris provided a series of animations from modeling runs so we could explore the outputs of his latest modeling efforts. For example, this phytoplankton simulation over twenty days.