Class on October 30 2018
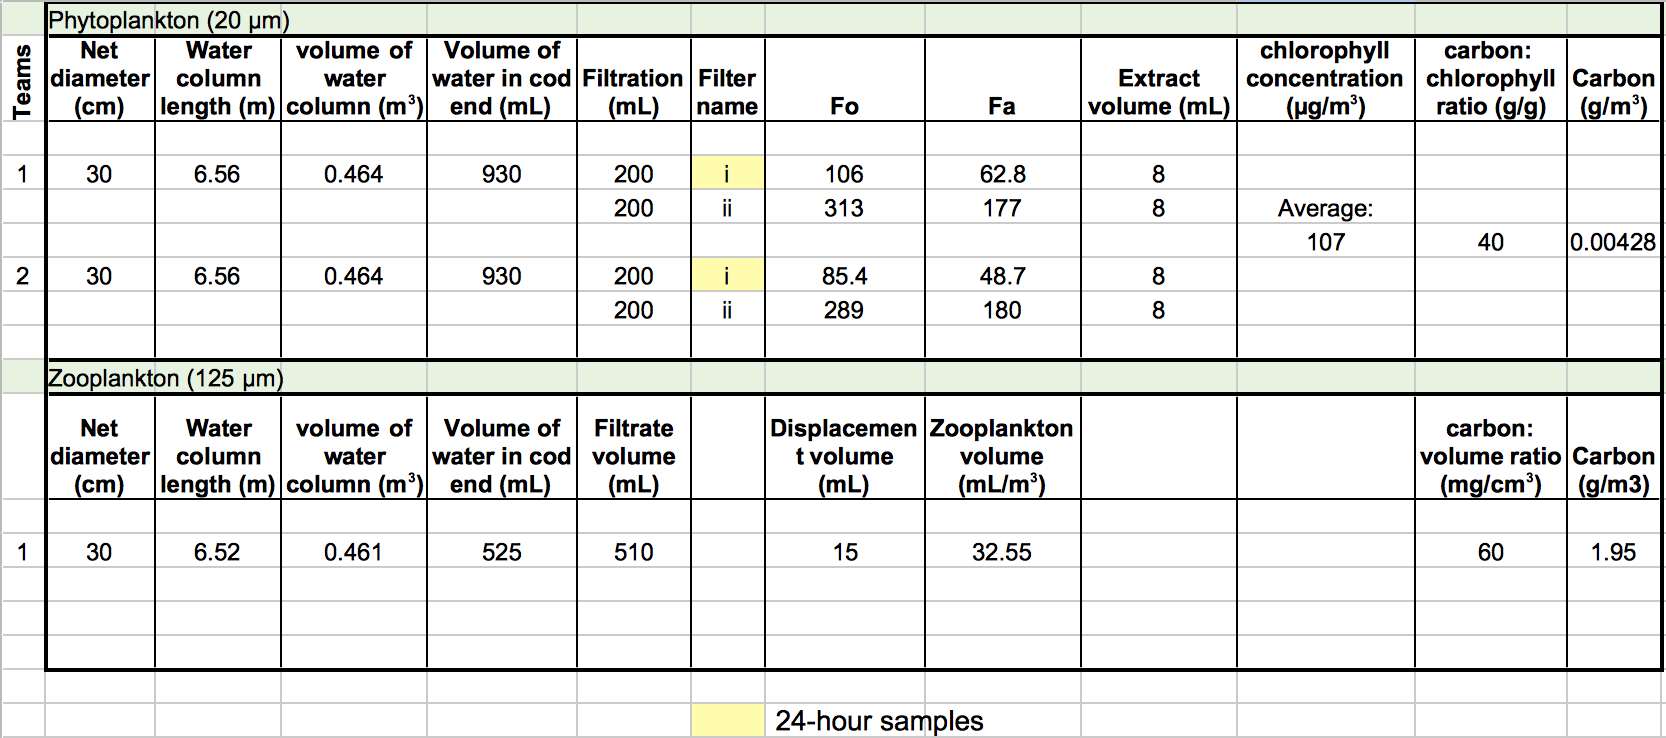
Lucy reviewed the plankton sampling analysis spreadsheet by walking through the computation involved to get the amount of carbon per

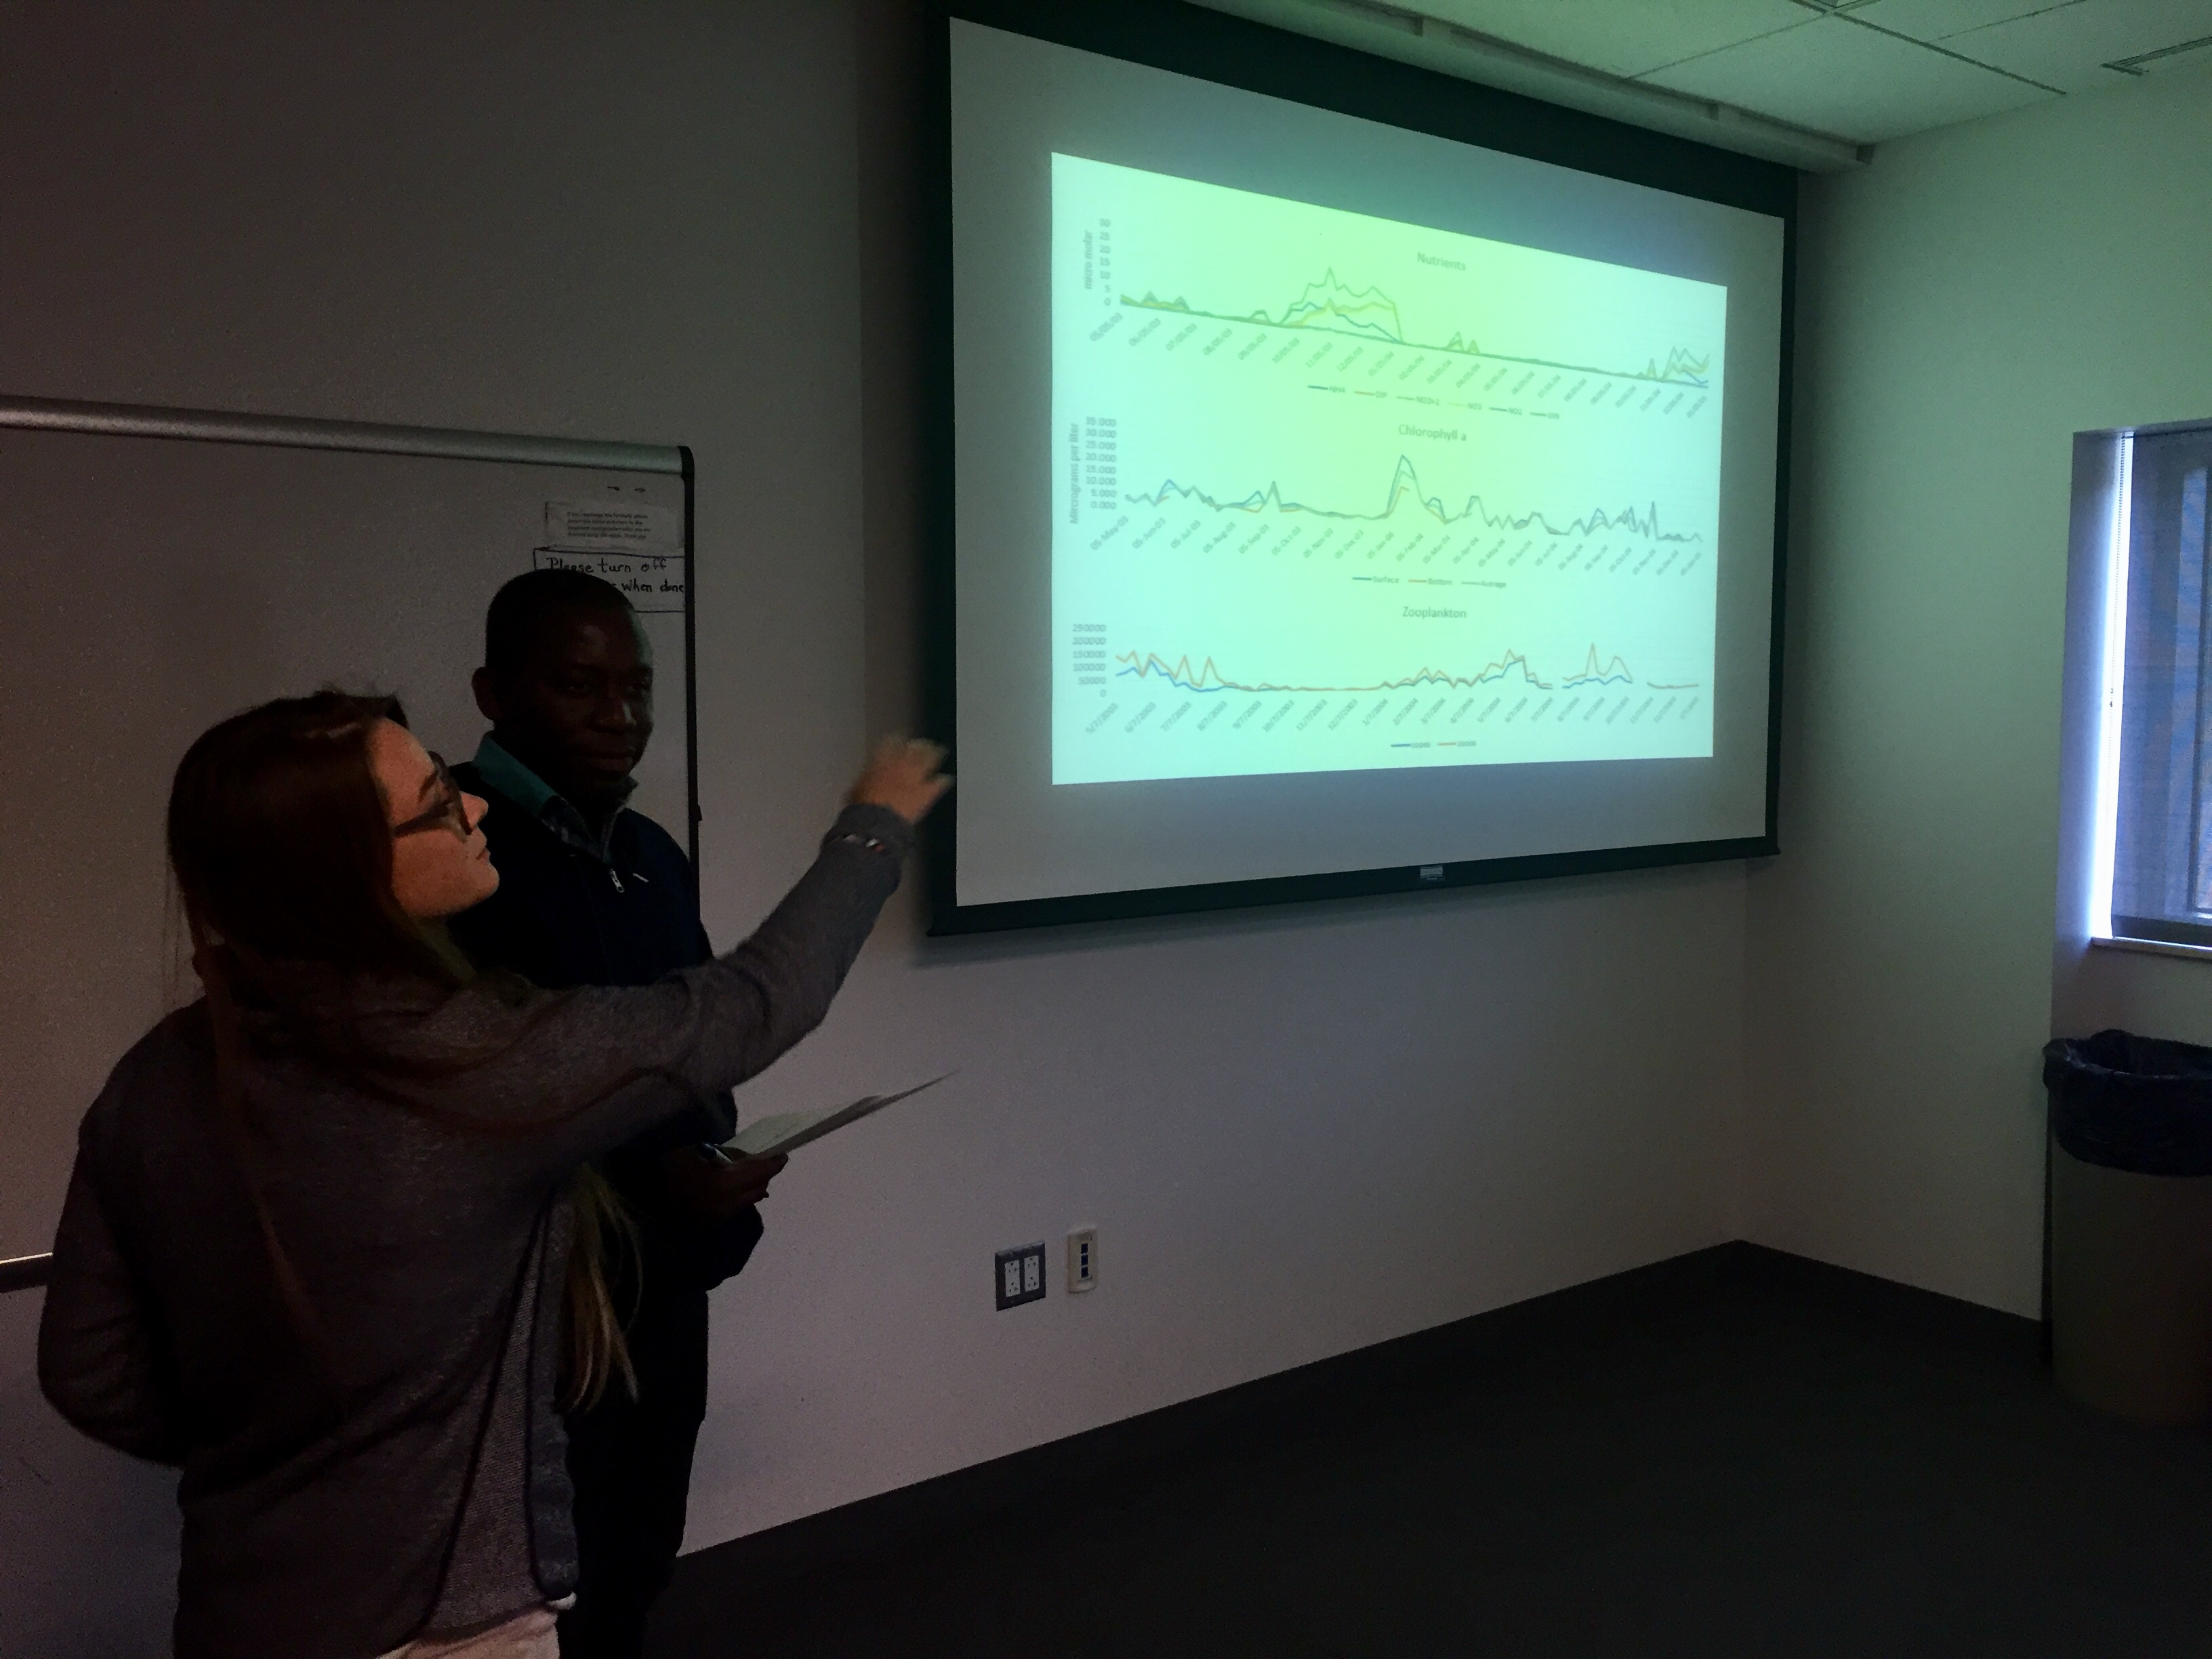
Jeremy then provided a spreadsheet that contained sampling data (CSV file export here) for nutrients, phytoplankton, and zooplankton sampled during 2003-2005 in Narragansett Bay. Students were assigned groups and a series of questions to answer in a worksheet which they worked on for a half hour. Students then presented their findings and were asked follow on questions by the faculty in attendance:

Example presentation thoughts:
1. What are the patterns in the time series charts? Describe the temporal sequence of NPZ quantities
over time?
Nutrients and phytoplankton are anti-correlated with a phase shift in zooplankton following phytoplankton. Nutrients spike in late winter with phytoplankton blooming in spring. Zooplankton grows in summer with phytoplankton and zooplankton activity during autumn.
2. Which nutrient is limiting? Which should we use for our model?
Upon considering a 16:1 nitrogen to phospherous Redfield ratio, nitrogen is limiting as the ratio of the sum of nitrogen to phospherous is less than 16 for the time period, except for late December, early January, and a single sampling date in March of one year. We should probably choose nitrogen as a result.
3. Should we explain total zooplankton or just the copepods in our model?
We might want to explain total zooplankton since there are some higher peaks where copepod activity remains low. But the copepods are the main grazers on phytoplankton and thus might best show the interaction between the two better.
4. What external drivers are important to consider?
Seasonal changes like temperature and light, storm events (windy and rainy weather) that can cause mixing in the water column and add a lot of fresh water from river input contribution, moon cycles for tidal effects, contributions of nutrients from river run off, sewer overflow, and thawing events in spring.
5. What should we do about the missing sample values in our spreadsheet? How could we fill them in?
We would want to interpolate values for the missing samples by averaging the previous and following sample values, perhaps just the closest one by date of each divided by two.
Jeremy ended the class with a discussion regarding top-down v. bottom-up control of food web behavior. The time series seen in the sampling data suggest a top-down control since zooplankton controls the values for phytoplankton and nutrients more so than nutrients control the values for phytoplankton and zooplankton. Zooplankton is at the highest trophic level in our modeling exercise.
A Python notebook is provided here to investigate the spreadsheet data interactively with Python code.

Jeremy then provided a spreadsheet that contained sampling data (CSV file export here) for nutrients, phytoplankton, and zooplankton sampled during 2003-2005 in Narragansett Bay. Students were assigned groups and a series of questions to answer in a worksheet which they worked on for a half hour. Students then presented their findings and were asked follow on questions by the faculty in attendance:

Example presentation thoughts:
1. What are the patterns in the time series charts? Describe the temporal sequence of NPZ quantities
over time?
Nutrients and phytoplankton are anti-correlated with a phase shift in zooplankton following phytoplankton. Nutrients spike in late winter with phytoplankton blooming in spring. Zooplankton grows in summer with phytoplankton and zooplankton activity during autumn.
2. Which nutrient is limiting? Which should we use for our model?
Upon considering a 16:1 nitrogen to phospherous Redfield ratio, nitrogen is limiting as the ratio of the sum of nitrogen to phospherous is less than 16 for the time period, except for late December, early January, and a single sampling date in March of one year. We should probably choose nitrogen as a result.
3. Should we explain total zooplankton or just the copepods in our model?
We might want to explain total zooplankton since there are some higher peaks where copepod activity remains low. But the copepods are the main grazers on phytoplankton and thus might best show the interaction between the two better.
4. What external drivers are important to consider?
Seasonal changes like temperature and light, storm events (windy and rainy weather) that can cause mixing in the water column and add a lot of fresh water from river input contribution, moon cycles for tidal effects, contributions of nutrients from river run off, sewer overflow, and thawing events in spring.
5. What should we do about the missing sample values in our spreadsheet? How could we fill them in?
We would want to interpolate values for the missing samples by averaging the previous and following sample values, perhaps just the closest one by date of each divided by two.
Jeremy ended the class with a discussion regarding top-down v. bottom-up control of food web behavior. The time series seen in the sampling data suggest a top-down control since zooplankton controls the values for phytoplankton and nutrients more so than nutrients control the values for phytoplankton and zooplankton. Zooplankton is at the highest trophic level in our modeling exercise.
A Python notebook is provided here to investigate the spreadsheet data interactively with Python code.

