

Class on October 11 2018
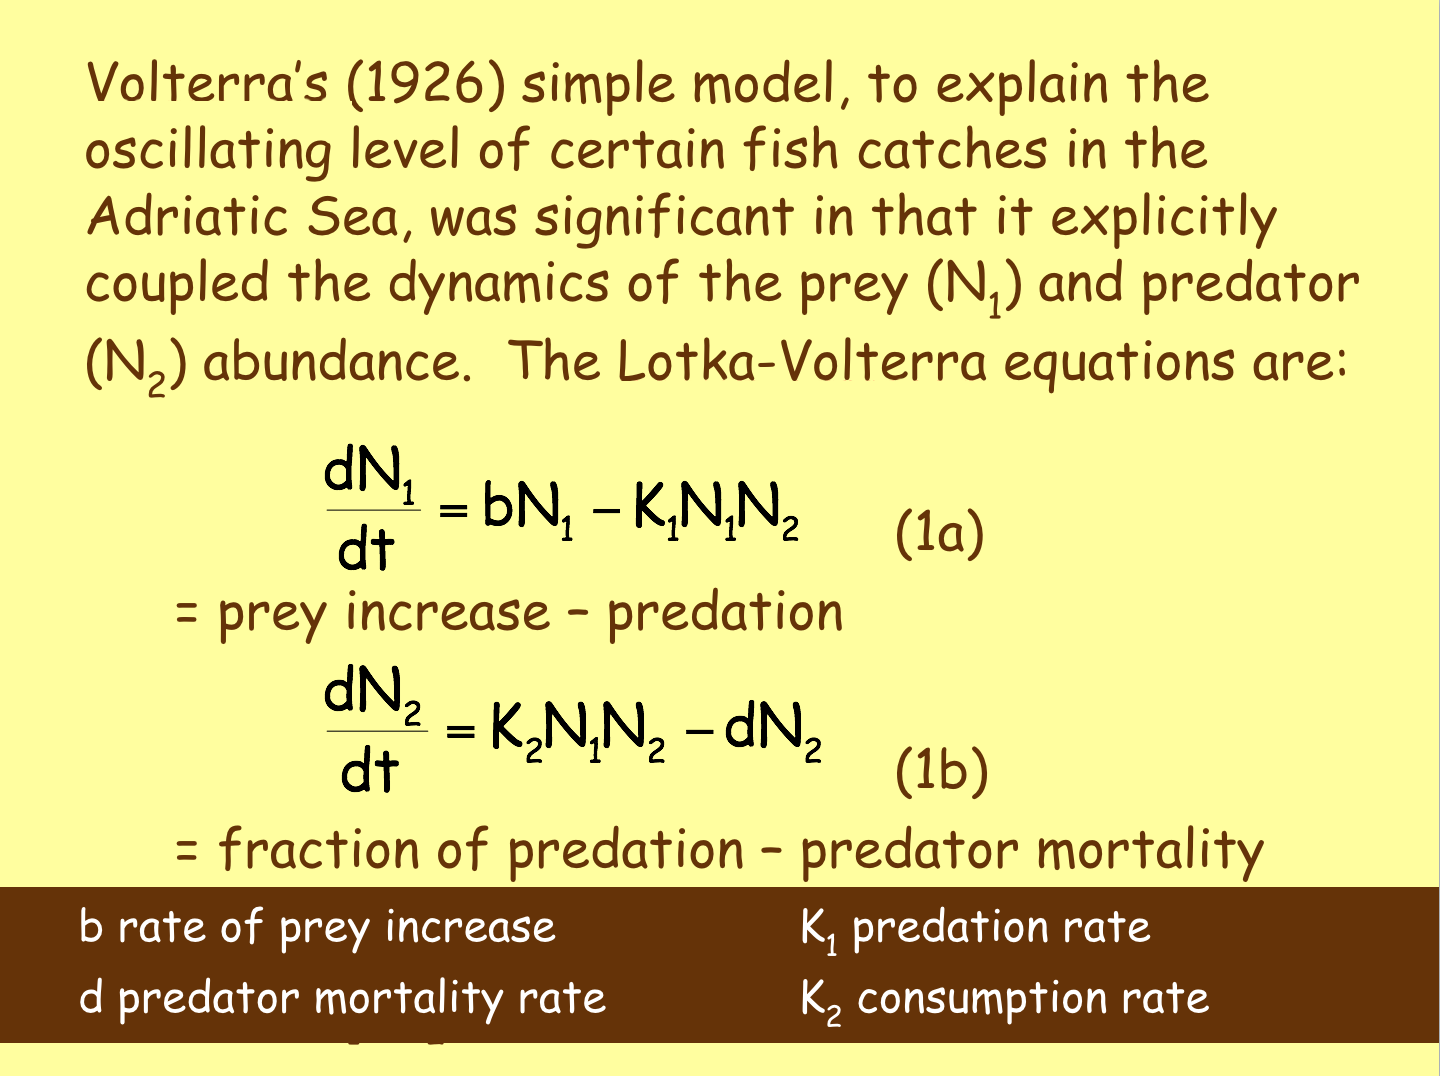
Students used a Jupyter Python Notebook to explore a predator-prey model based on Lotka-Volterra equations:
Students were asked to perform a sensitivity analysis on the model after Lucie and Bruce motivated an interactive discussion of the equations and the Python statements that could help perform an analysis. Bruce explained the usefulness of performing a sensitivity analysis that looked at each variable (and variables in combination) to see how sensitive the results of formulas are changed by a change in the variable value. Insight as to time and resources to spend in determining realistic values for each variable can result. Bruce suggested values for each variable as:
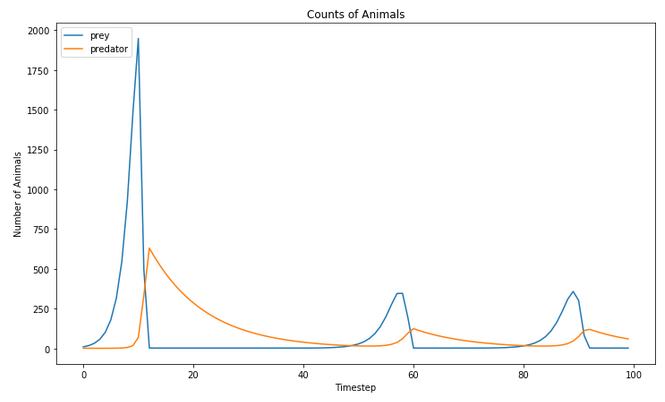
Bruce then discussed the value of doing a post-model reasonability assessment on model outputs. Typically scientists look for outputs to be in a reasonable range based on their knowlege base (including broader published findings). Three representative outcomes to consider are the average number of prey, the average number of predators, and the ratio of prey to predator. Students were asked to think of other reasonability checks, perhaps regarding the visual plots, that might be important when doing a sensitivity analysis. He mentioned the frequency and amplitude of any cyclical patterns seen, for example on the cycles from the starting conditions of the notebook as downloaded:
Bruce would spend some time at the start of next class to discuss what students thought in terms of model output reasonability checks and any calculations they performed.
Students were then encouraged to ask questions regarding the shark-striper Python notebook that was provided last class for their consideration/use. Bruce provided insight into the motivation of what he believed were some of the more obscure lines of code.
Students were asked to perform a sensitivity analysis on the model after Lucie and Bruce motivated an interactive discussion of the equations and the Python statements that could help perform an analysis. Bruce explained the usefulness of performing a sensitivity analysis that looked at each variable (and variables in combination) to see how sensitive the results of formulas are changed by a change in the variable value. Insight as to time and resources to spend in determining realistic values for each variable can result. Bruce suggested values for each variable as:
| variable | half value | value | double value |
|---|---|---|---|
| b | .2 | .4 | .8 |
| d | .05 | .1 | .2 |
| k1 | .01 | .02 | .04 |
| k2 | .001 | .002 | .004 |
| n1 | 3 | 6 | 12 |
| n2 | 1 | 2 | 4 |
Bruce then discussed the value of doing a post-model reasonability assessment on model outputs. Typically scientists look for outputs to be in a reasonable range based on their knowlege base (including broader published findings). Three representative outcomes to consider are the average number of prey, the average number of predators, and the ratio of prey to predator. Students were asked to think of other reasonability checks, perhaps regarding the visual plots, that might be important when doing a sensitivity analysis. He mentioned the frequency and amplitude of any cyclical patterns seen, for example on the cycles from the starting conditions of the notebook as downloaded:
Bruce would spend some time at the start of next class to discuss what students thought in terms of model output reasonability checks and any calculations they performed.
Students were then encouraged to ask questions regarding the shark-striper Python notebook that was provided last class for their consideration/use. Bruce provided insight into the motivation of what he believed were some of the more obscure lines of code.