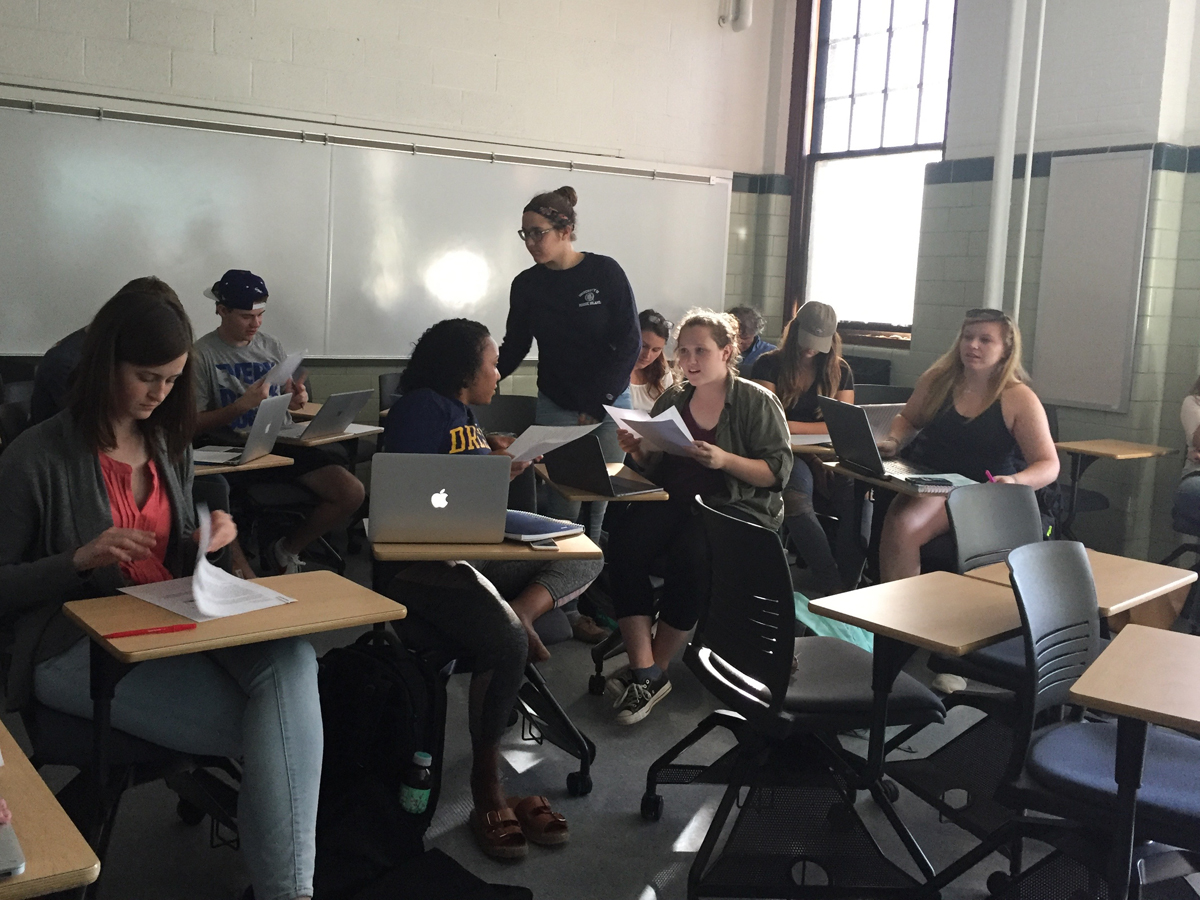
Class on October 3 2017
Rob started off by going over what makes a good field report (the sections and the purpose for each section):
Students then handed the report they critiqued back to the student who wrote it:

Rob asked students to say major comments from student critiques:
Chris suggested to work with figures first before writing text and to really put effort into the captions so they explain images well.
Chris segued to thinking about online sharing of information via strong argument with some brevity by video.
Bruce introduced students to the PODS Content Management System after suggesting students imagine they were each submitting a field report as part of a study with geographical extent by which each student were a scientist reporting on field work in a different estuary/river system. Bruce discussed the merits of CMS when trying to facilitate a specific group of people to develop a community of knowledge.
Bruce gave each student a CMS account and had them login to become familiar with their landing page and action menu.
Students were then encouraged to submit their field report using tutorial instructions.
Rob, Grace, Chris and Bruce helped students perform that task after Bruce demonstrated with Rob's field report example.
Rob encouraged students to iterate upon their uploaded report as homework to improve it based on critique from the class.
(0) Abstract
    In a short paragraph (< 4 sentences) describe:
    * purpose of the activity
    * location
    * measurement(s) made or instrumentation used
    * main result(s)

(1) Introduction
    Describe the field activity:
    * what you are doing (e.g., conduct temperature survey of Narrow River)
    * when (e.g., Sept. 14, 2017, from 3:30-5:00 PM local)
    * where (e.g., lower Narrow River, show map if appropriate),
    * other information as suitable (e.g., tide, weather, vessel/platform)

(2) Methodology
    Describe how you are carrying out the survey/experiment:
    * what measurements/data you are using
    * what instruments you are using
    * placement/arrangement of instruments
    * other information as suitable (e.g., sampling rates)

(3) Results (Data presentation)
    Show data (as table, graph and/or map, whatever is appropriate)
    Describe the results (e.g., patterns/trends), but do not interpret them!

(4) Interpretation and Analyses
    Here you demonstrate how you use the data:
    * describe potential causes/relationships of the observed patterns/trends
    * provide any additional info (e.g., graphs) that may support your interpretation

(5) Summary and Conclusion
    In brief words, summarize the findings of your experiment.
    This should not be a simple repetition of things listed in (1) through (4) or the abstract.

(6) References
    If you used references to other people's work (scientific papers, manuals, internet information, etc.),
    list it here with an appropriate style format (e.g., APA style)
    c.f. https://owl.english.purdue.edu/owl/resource/560/01/

(7) What I Learned
    List up to 3 things that you learned (e.g., scientific, logistical or other)

(8) Questions I Still Have
    List/describe up to 3 things that you have questions about (e.g., scientific, logistical or other)
He then handed each student a paper-based field report from a different student and asked them to critique that physical report (write on them with pen to provide feedback).
Students then handed the report they critiqued back to the student who wrote it:

Rob asked students to say major comments from student critiques:
- Errors on the graph axes
- Errors on the graph contents
- Not enough detail on what happened
- Confusion between explanation and observation
- Layout clutter
Chris suggested to work with figures first before writing text and to really put effort into the captions so they explain images well.
Chris segued to thinking about online sharing of information via strong argument with some brevity by video.
Bruce introduced students to the PODS Content Management System after suggesting students imagine they were each submitting a field report as part of a study with geographical extent by which each student were a scientist reporting on field work in a different estuary/river system. Bruce discussed the merits of CMS when trying to facilitate a specific group of people to develop a community of knowledge.
Bruce gave each student a CMS account and had them login to become familiar with their landing page and action menu.
Students were then encouraged to submit their field report using tutorial instructions.
Rob, Grace, Chris and Bruce helped students perform that task after Bruce demonstrated with Rob's field report example.
Rob encouraged students to iterate upon their uploaded report as homework to improve it based on critique from the class.

