

Class on November 9 2017
Chris started out by asking students about circulation and temperature and salinity transport. Then he asked about density and stratification. Students gave reasonable definition of the concept. Chris drew the profile of the narrow river estuary and asked where the salt was (and which direction it came from).
Side discussion of neuropathy and slapcheek (fifthed disease).
Rob and Chris found in the summer:
Salinity in the ocean is around 29.5 PSU
Temperature is around 20 °C
(winter: 29.7 PSU salinity and 4.5 °C)
Chris asked Katie to organize Jake (sun), Rose (earth), and Gavin (moon) in a demonstration of neap and spring tides.
Then he did a rope demonstration with the profile of the bathymetry (river to pond). Students were each given a latitude in the river/pond system and a salinity level and had to find where they would be within the profile. Neap, average, and Spring tides then moved students around to demonstrate where the parcel of water would go.
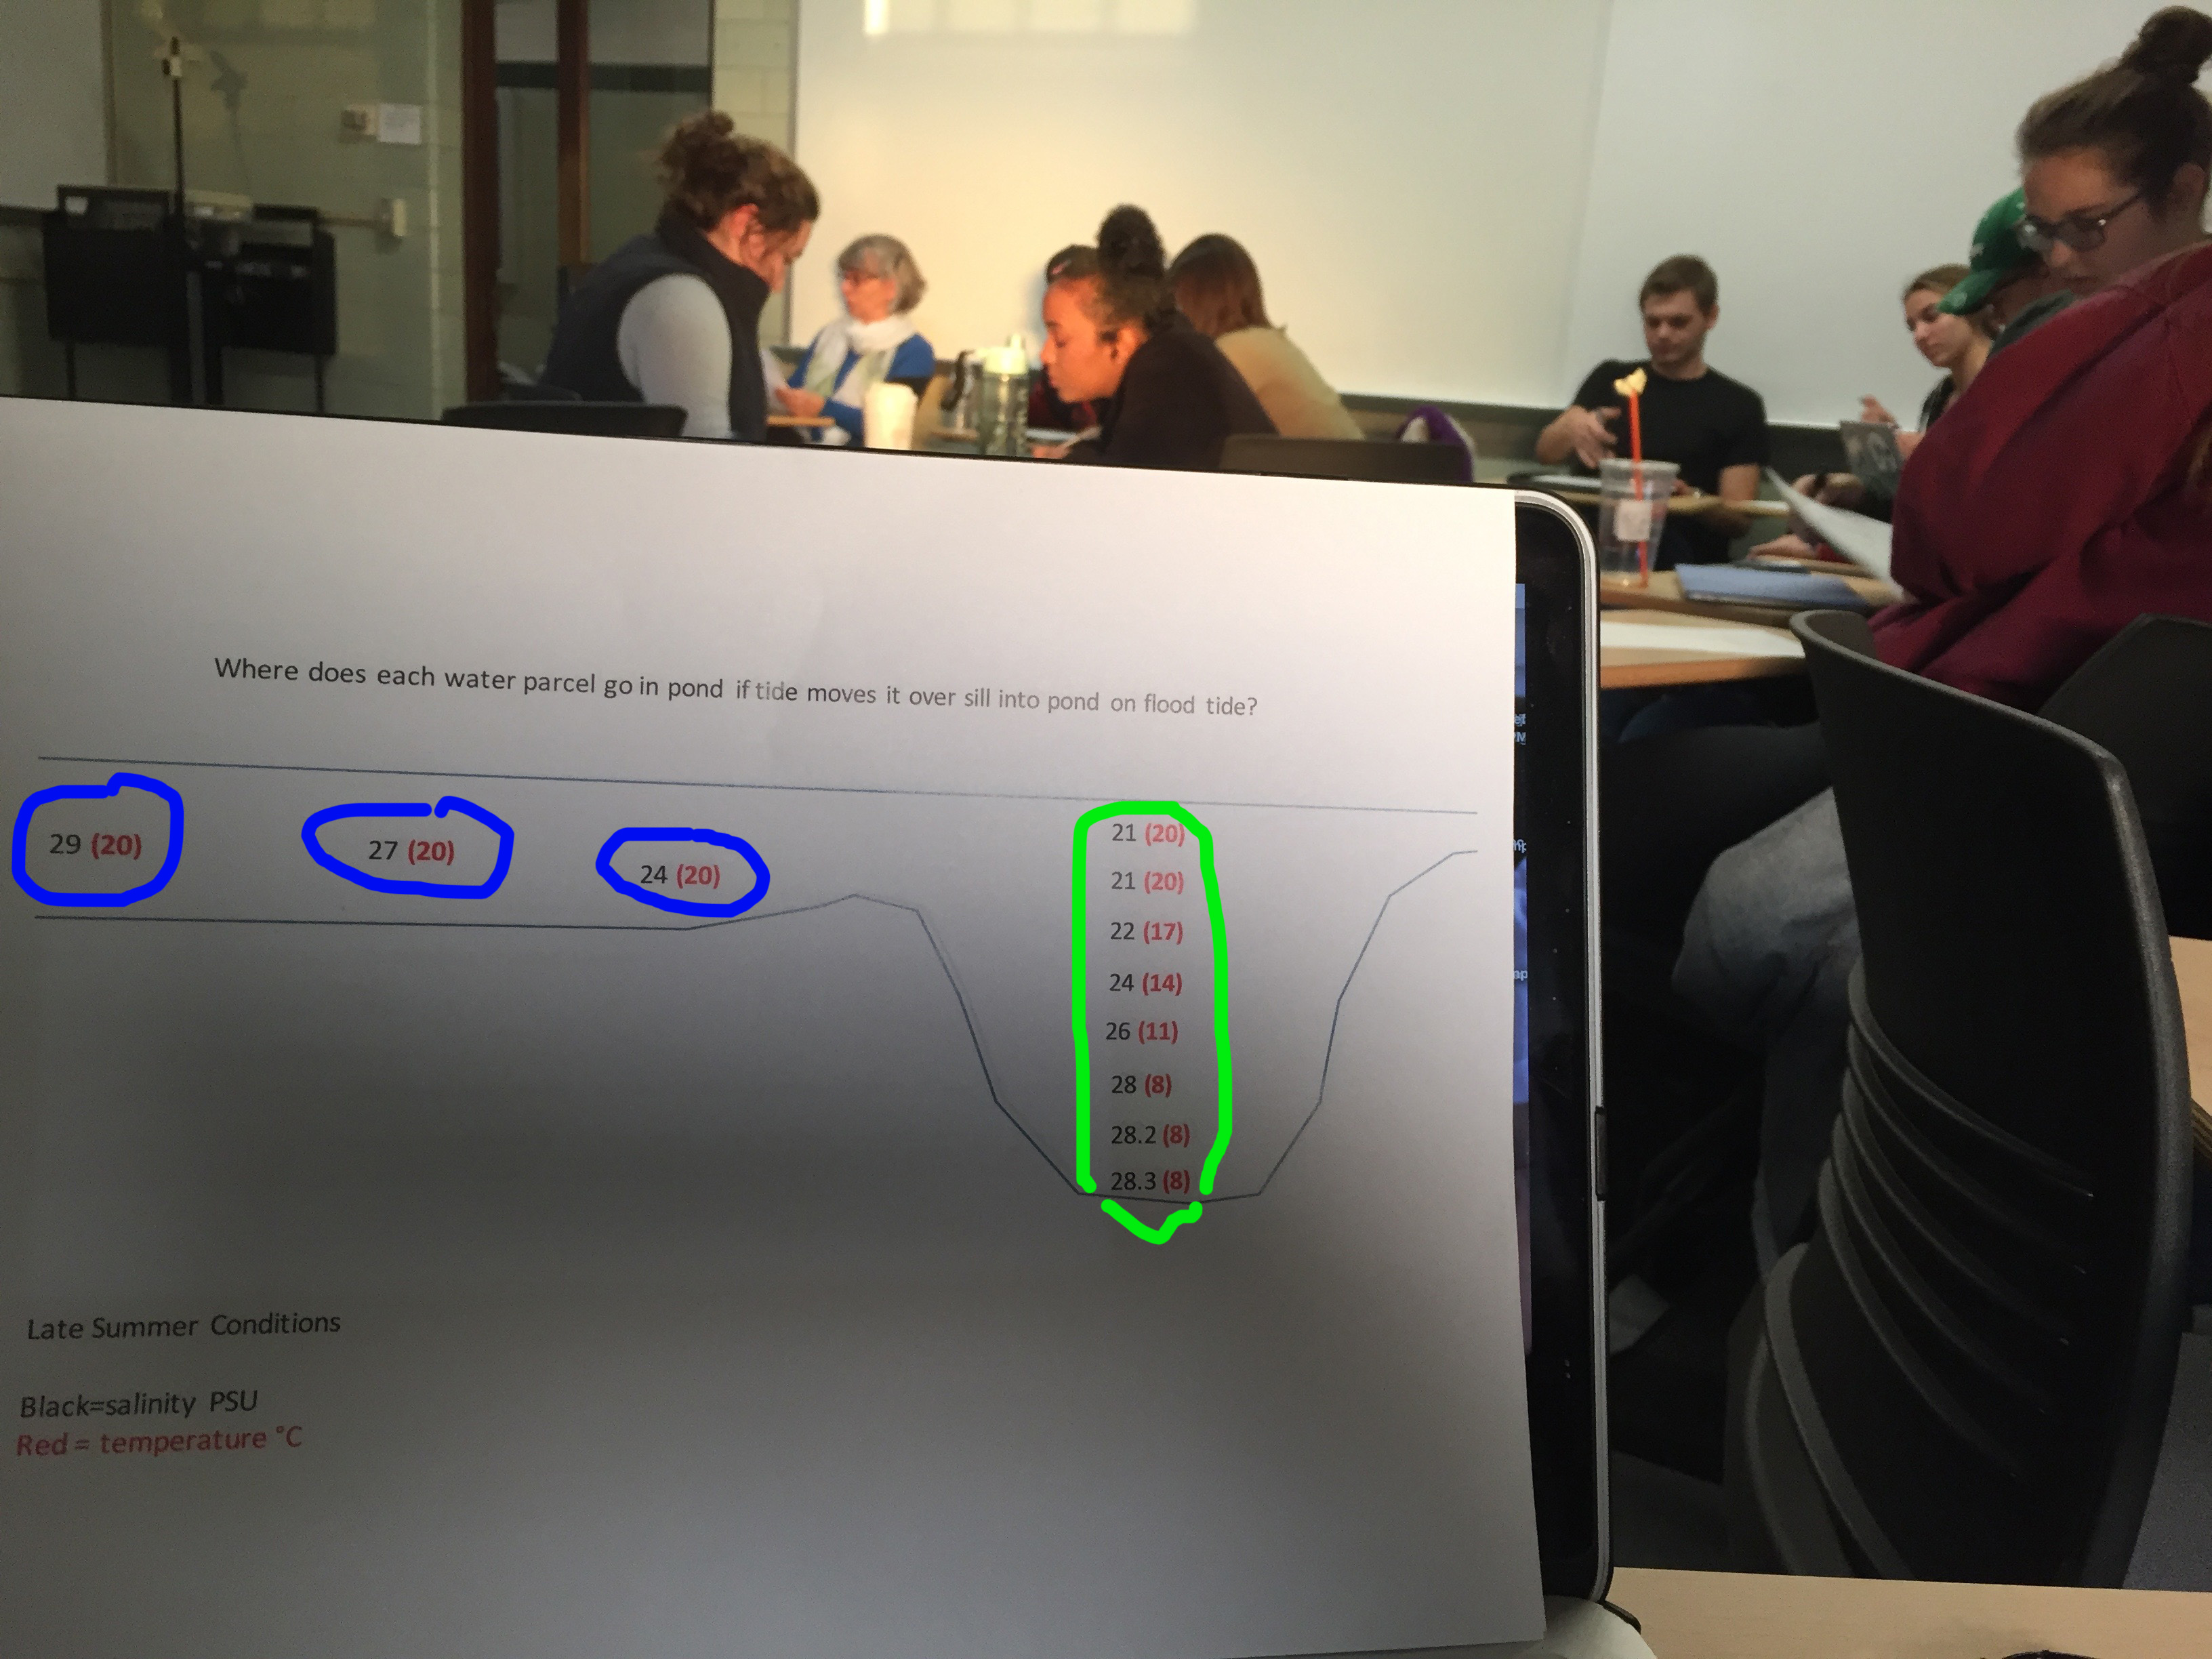
Students were given a paper starting condition of the profile (temperature and salinity) and had to determine how the tides would work in bringing in water parcels from the shallow into the deeper pond area. There were four different starting conditions loosely based on the four seasons (the winter data was made up)
As an example, see the image below. The three parcels of water (encircled in blue) are being pushed upstream (to the right) by the tide. Parcels are described by their characteristic salinity (PSU) in black and temperature (°C) in red. As they reach the pond to the right, where would the parcels end up within the vertical column of water given the reported conditions there now?
The winter one was the most curious since it was unfamiliar to us. Katie pointed out that for the winter condition to be stable, salinity would have to have a more dominant effect or else there would have to be some significant forcing agent creating such a condition.
Side discussion of neuropathy and slapcheek (fifthed disease).
Rob and Chris found in the summer:
Salinity in the ocean is around 29.5 PSU
Temperature is around 20 °C
(winter: 29.7 PSU salinity and 4.5 °C)
Chris asked Katie to organize Jake (sun), Rose (earth), and Gavin (moon) in a demonstration of neap and spring tides.
Then he did a rope demonstration with the profile of the bathymetry (river to pond). Students were each given a latitude in the river/pond system and a salinity level and had to find where they would be within the profile. Neap, average, and Spring tides then moved students around to demonstrate where the parcel of water would go.
Students were given a paper starting condition of the profile (temperature and salinity) and had to determine how the tides would work in bringing in water parcels from the shallow into the deeper pond area. There were four different starting conditions loosely based on the four seasons (the winter data was made up)
As an example, see the image below. The three parcels of water (encircled in blue) are being pushed upstream (to the right) by the tide. Parcels are described by their characteristic salinity (PSU) in black and temperature (°C) in red. As they reach the pond to the right, where would the parcels end up within the vertical column of water given the reported conditions there now?
The winter one was the most curious since it was unfamiliar to us. Katie pointed out that for the winter condition to be stable, salinity would have to have a more dominant effect or else there would have to be some significant forcing agent creating such a condition.