

Class on October 19 2017
Chris introduced the goals of the class (to download partial data to plot temporal sections)
Students spent time plotting their temporal data.
Chris organized a plotting of everyone's averages for surface temperature, temperature at 8 meters depth, and average decimal day.
An example of their assignment appears here:
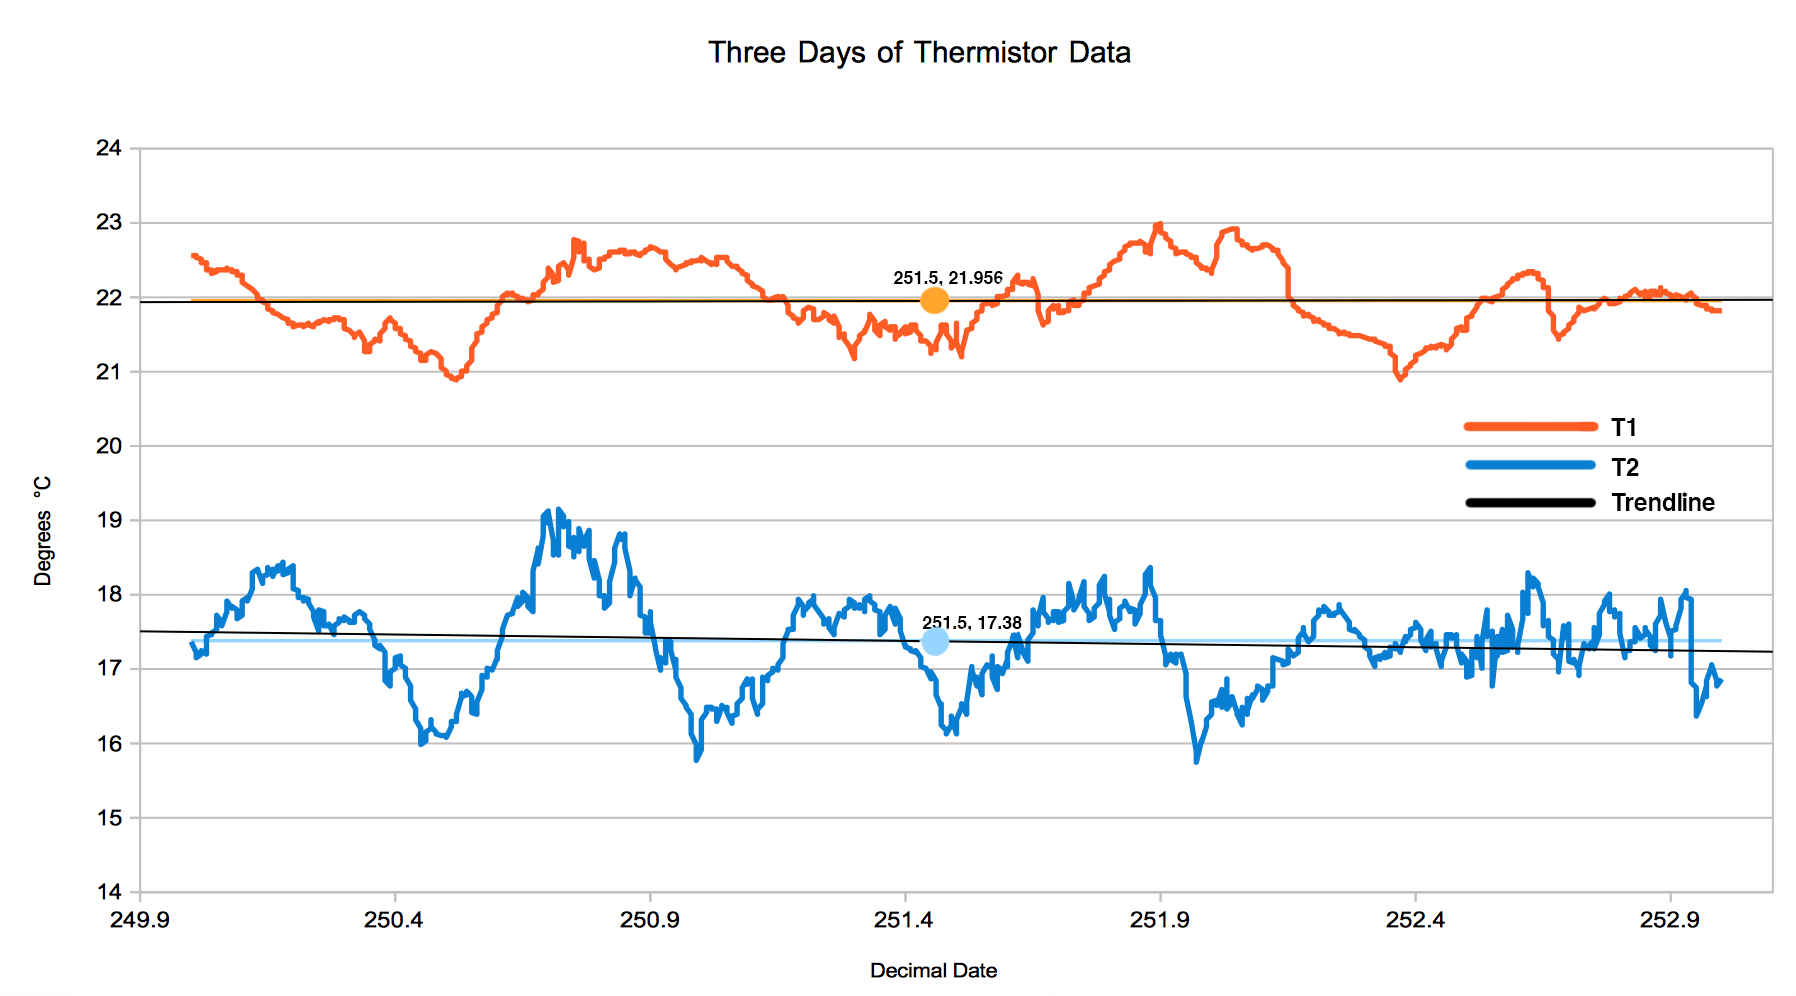
Students presented thoughts about their segment of the overall time series (average, trend, line equations).
Chris pointed out what the averaging provided as a plot compared to all the data points.
Rob provided an overview of decomposition (deconvolution) of a complex wave into component waves of different frequencies (tide once every 12.4 hours, day night every 24 hours, and spring-neap every 14 days). Leftover data, if not a significant pattern, can be attributed to noise.
Rob then showed an example of convolution from three sub-waves with different frequencies.
Rob used three volunteers (Mike, Gavin, and Josh) as Sun, Moon, and Earth to show their relative movements (rotation and revolution). The concepts of spring and neap tides were shown as positional concepts (the sun providing 40% of the pull and the moon 60% of the pull on the envelope of water).
Rob clarified why there is high tide on the backside of the Earth when the moon and sun are aligned behind the point of consideration. The Earth and moon are coupled and orbit around each other around a pivot point. As they move around the pivot point, the water pushes outward.
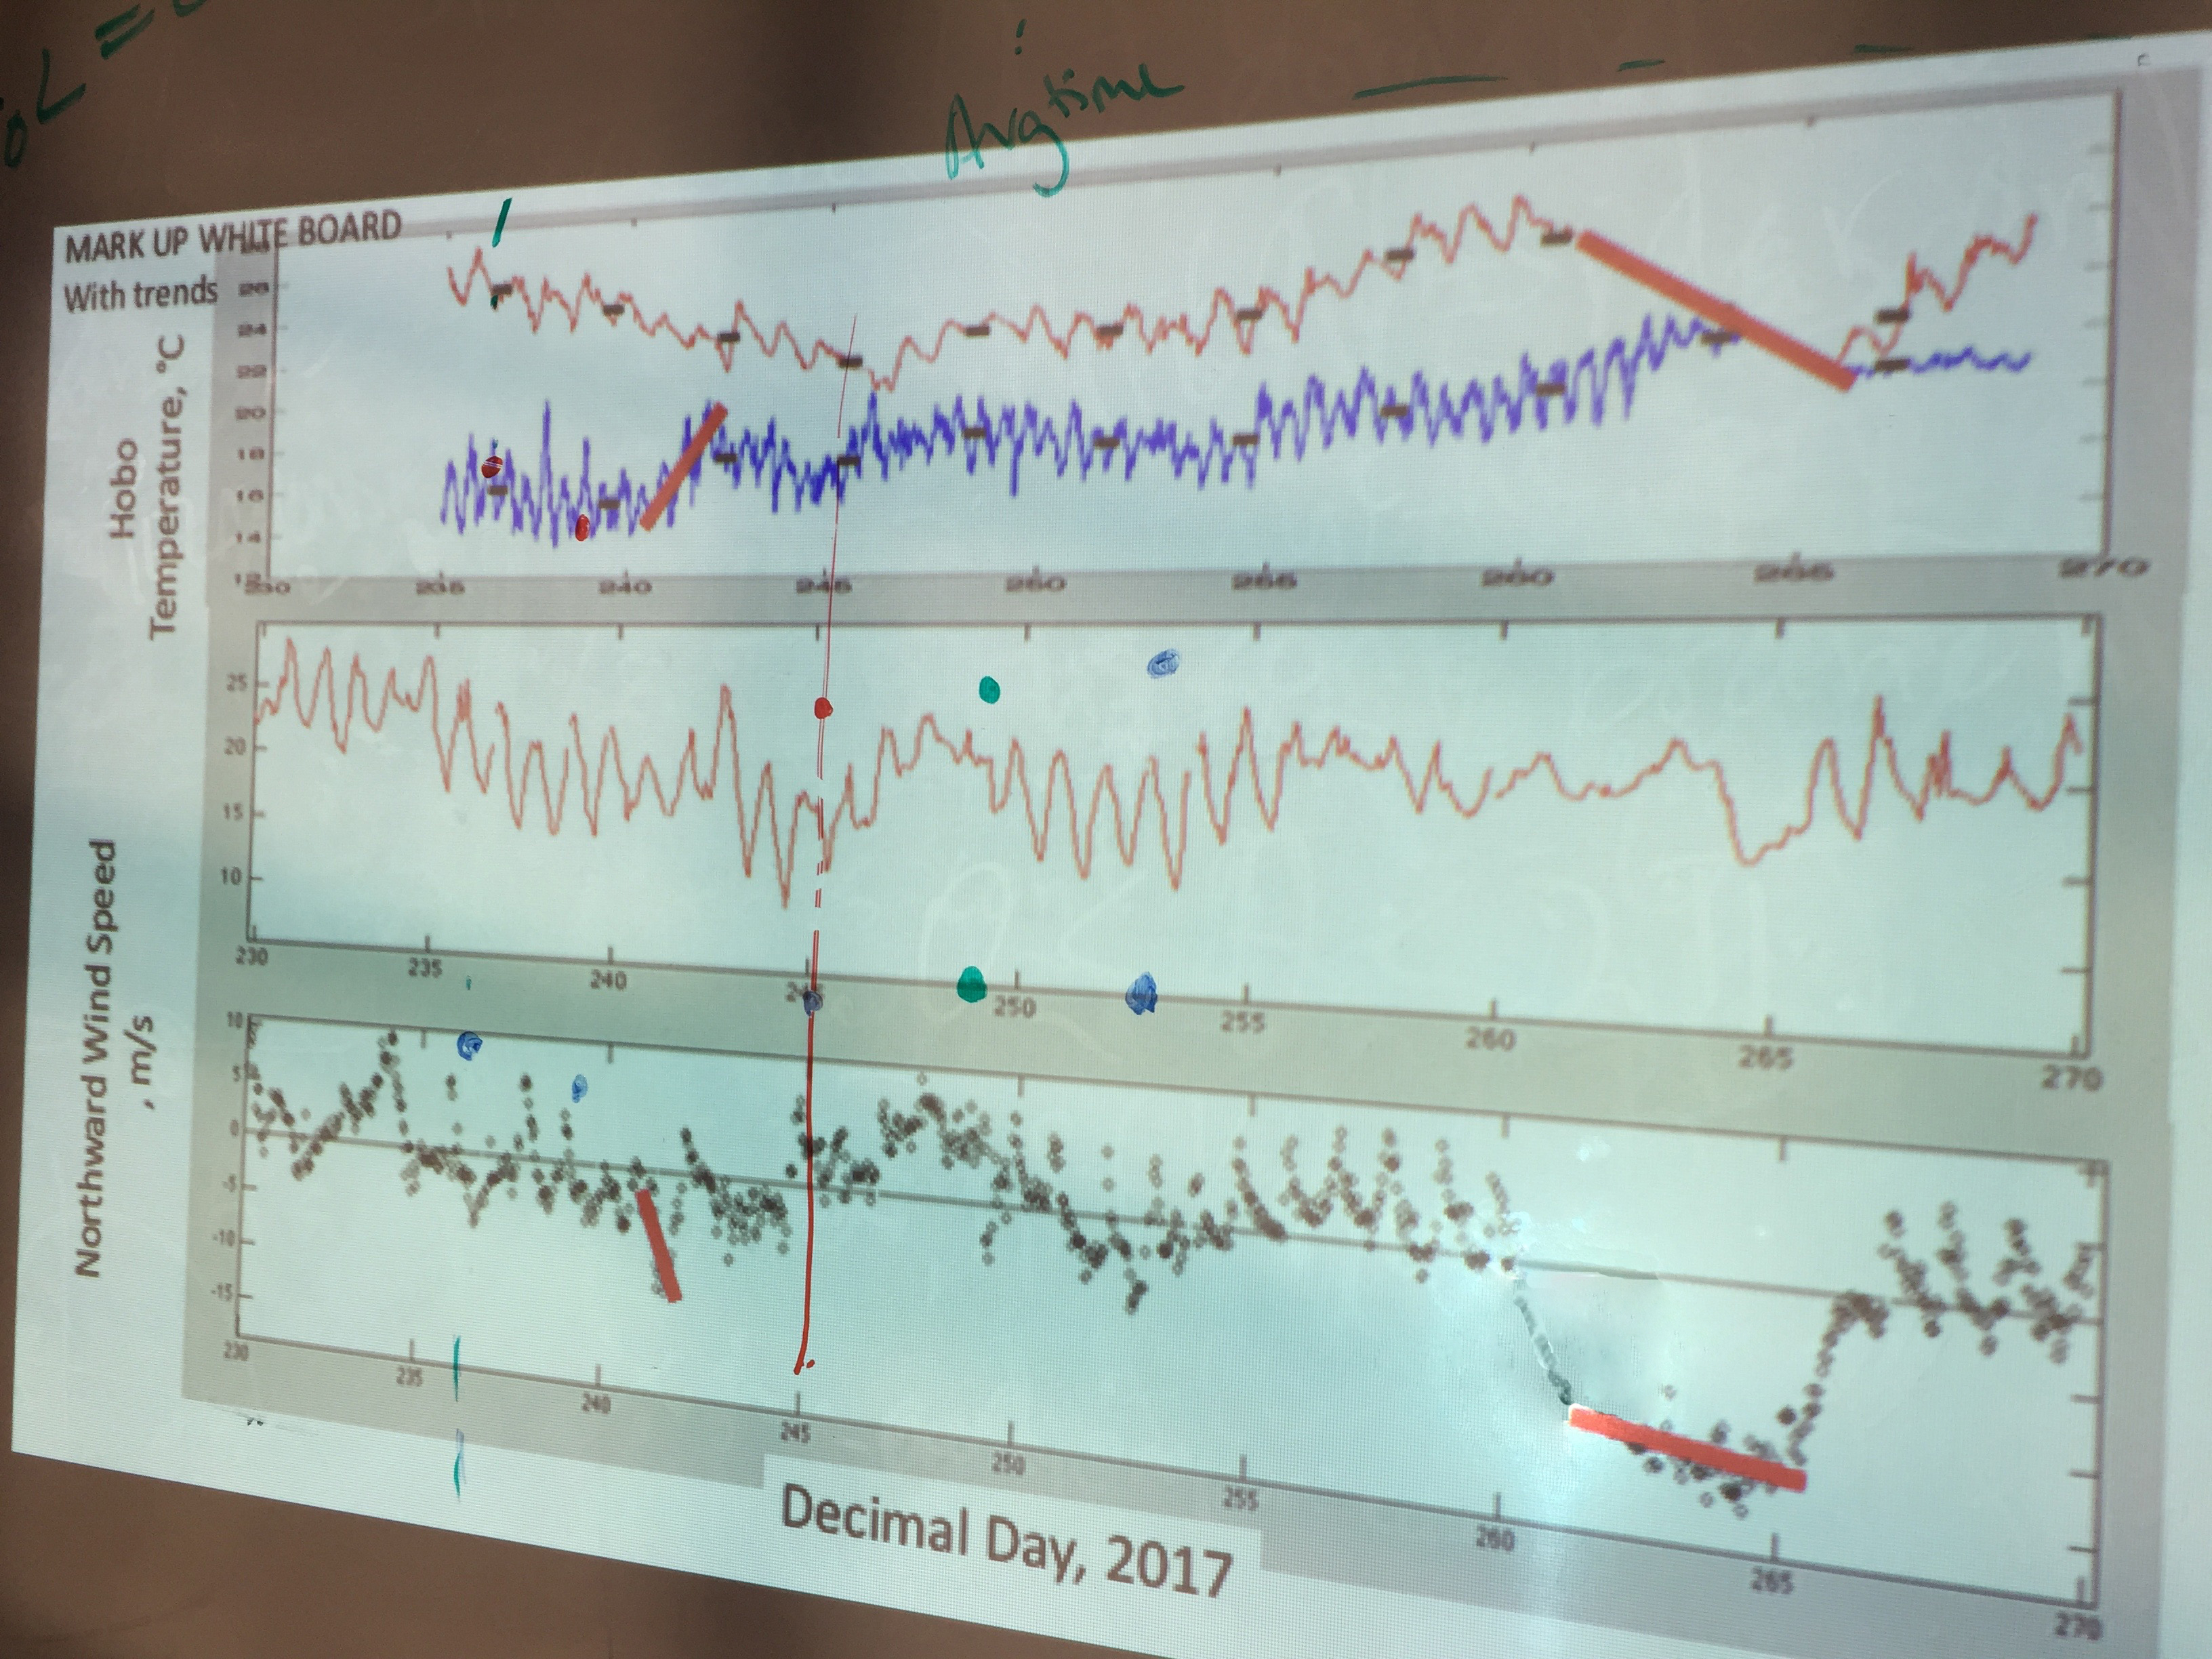
Rob then looked for evidence of the spring-neap cycle in the Lower Pond thermistor data.
Students were asked to finish their graph work as homework.
Students spent time plotting their temporal data.
Chris organized a plotting of everyone's averages for surface temperature, temperature at 8 meters depth, and average decimal day.
An example of their assignment appears here:
Students presented thoughts about their segment of the overall time series (average, trend, line equations).
Chris pointed out what the averaging provided as a plot compared to all the data points.
Rob provided an overview of decomposition (deconvolution) of a complex wave into component waves of different frequencies (tide once every 12.4 hours, day night every 24 hours, and spring-neap every 14 days). Leftover data, if not a significant pattern, can be attributed to noise.
Rob then showed an example of convolution from three sub-waves with different frequencies.
Rob used three volunteers (Mike, Gavin, and Josh) as Sun, Moon, and Earth to show their relative movements (rotation and revolution). The concepts of spring and neap tides were shown as positional concepts (the sun providing 40% of the pull and the moon 60% of the pull on the envelope of water).
Rob clarified why there is high tide on the backside of the Earth when the moon and sun are aligned behind the point of consideration. The Earth and moon are coupled and orbit around each other around a pivot point. As they move around the pivot point, the water pushes outward.
Rob then looked for evidence of the spring-neap cycle in the Lower Pond thermistor data.
Students were asked to finish their graph work as homework.