

Class on October 17 2017
Rob started off the class with a powerpoint presentation that shared videos for graphing/charting exercises.
Students downloaded CSV files from Sakai to use in Google Sheets charting practice.
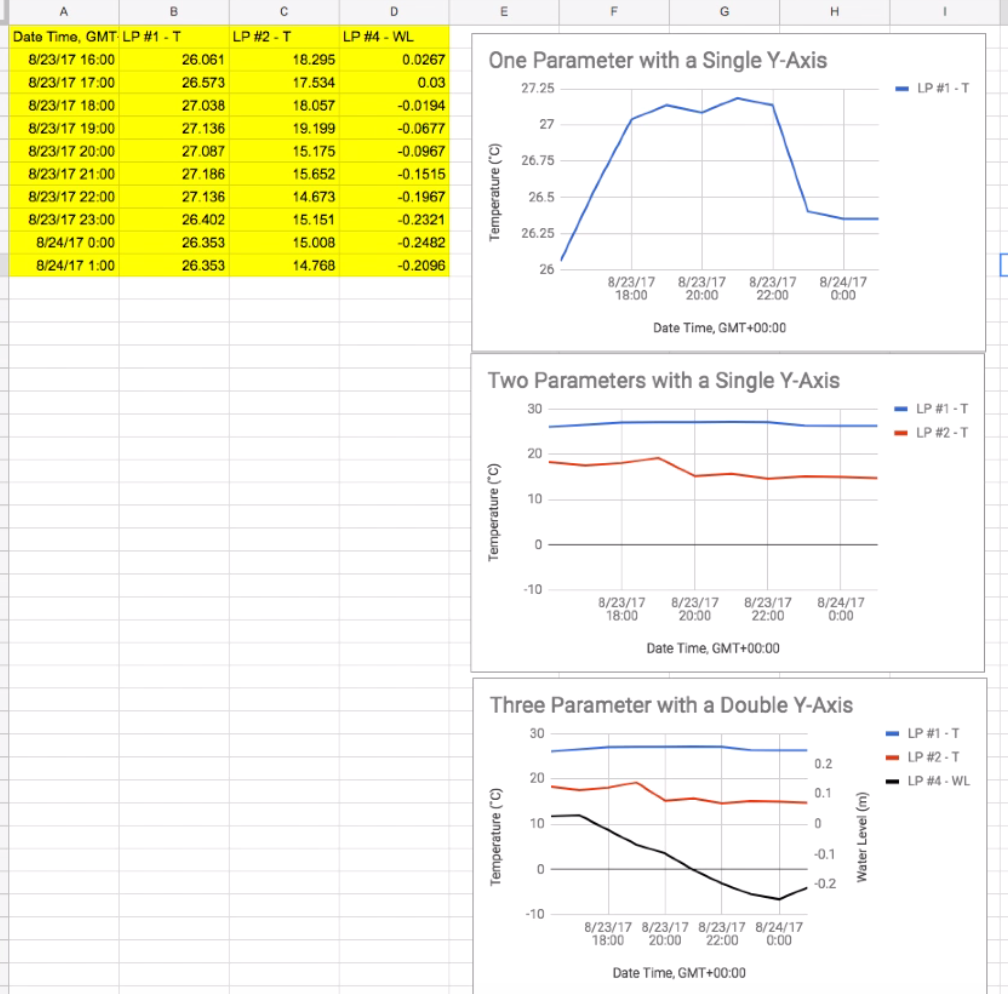
Students first created charts with a single parameter across time, two parameters across time, and three parameters across time with two vertical axes.
Then students then created a chart with different date values but from same temporal bounds.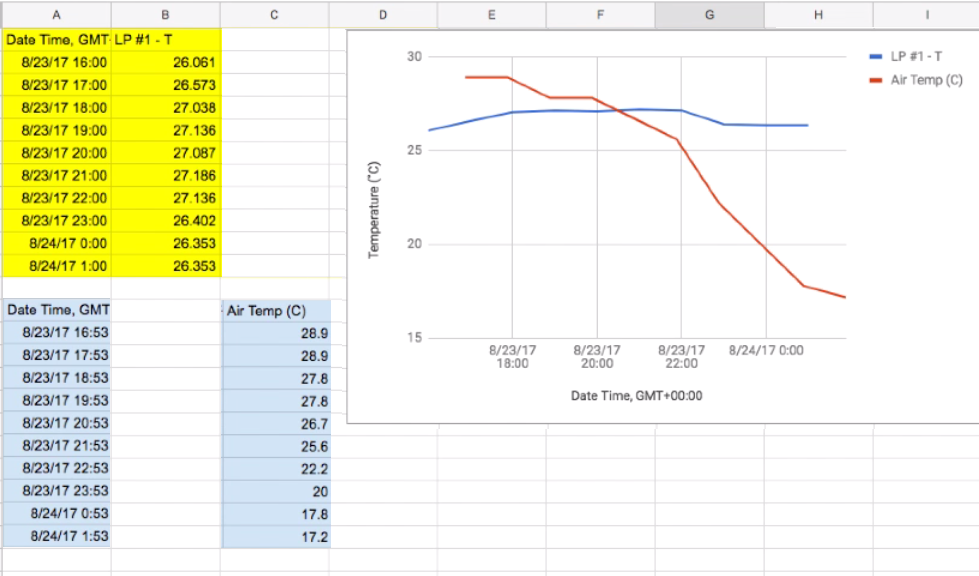
Rob asked for interpretations of the Lower Pond data students had considered for homework.
Jasmine, Lexi, Rose all discussed the Lower Pond data visualization (water temperatures and water level). They used evidence from external data sets to support their observations.
Jake looked at the sinusoidal effect of sunrise and sunset in the change in surface temperature. Rob showed the data for air v. surface water for a day as a double-Y axis plot.
Then students presented the most compelling part of their field report where additional external data sets were used.
Chris then assigned a homework set for graphing.
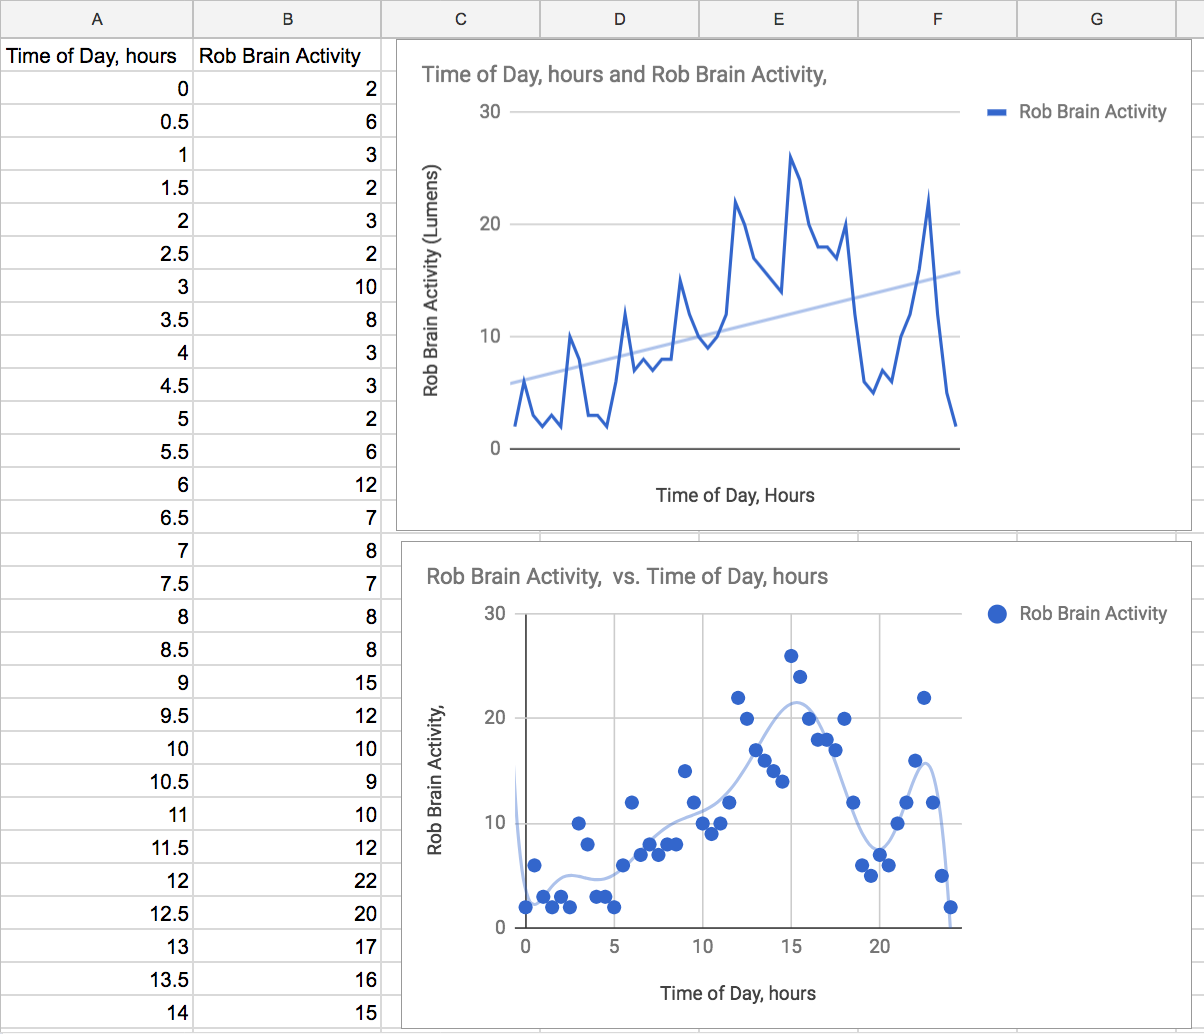
Students were asked to finish their graph work as homework.
Students downloaded CSV files from Sakai to use in Google Sheets charting practice.
Students first created charts with a single parameter across time, two parameters across time, and three parameters across time with two vertical axes.
Then students then created a chart with different date values but from same temporal bounds.
Rob asked for interpretations of the Lower Pond data students had considered for homework.
Jasmine, Lexi, Rose all discussed the Lower Pond data visualization (water temperatures and water level). They used evidence from external data sets to support their observations.
Jake looked at the sinusoidal effect of sunrise and sunset in the change in surface temperature. Rob showed the data for air v. surface water for a day as a double-Y axis plot.
Then students presented the most compelling part of their field report where additional external data sets were used.
Chris then assigned a homework set for graphing.
Students were asked to finish their graph work as homework.